When you download the results from a test or study session, the .zip file will contain:
-
Any files generated and saved by your script
-
Three .json files:
-
results: a list of all files included in the folder, the “invite data” and the “end status” of the session
-
inputs: a list of keyboard and mouse inputs from the session
-
stream: file which contains several measurements pertaining to stream metadata e.g. network latency, bit rate etc.
-
-
A log file named experiment, containing all command window/console output generated during the session.
.json files can be opened in notepad or another text editor, for easy review.
Results file
The results file lists the session start and end time, session invitation data, a list of files included in the results folder, and the end status of the experiment.
If you are using Prolific invitation links, you will also see the Prolific tags for the Prolific PID, Study ID and Session ID.
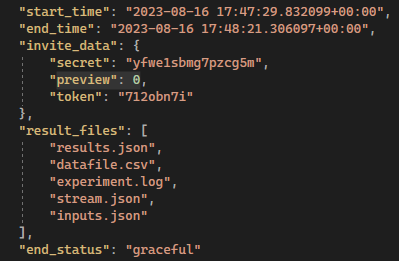
Start and end times: These reflect the start and end of the session on the server side, with sub-millisecond precision. These times are used to determine the billing of credits. Event timestamps are in the format: Year-Month-Day HH:MM:SS.SSSSS, reported in GMT.
Invite data:
-
Secret: the unique invitation link text which was used to access the experiment (for internal use mainly)
-
Preview: indicates whether the session was a test or study session (“0” for test, and “1” for study),
-
Token: an identifier for the subject; this is the token ID associated with the invitation link.
Result files: A list of all the files contained in the results folder including any files that were saved in the script (.mat, .csv, image files etc.), the experiment log file, and the JSON files.
End status: classification of the session which can take on the following values
|
Status |
Description |
|---|---|
|
graceful |
a successful completion of the experiment (within the time limit) |
|
failure |
the experiment code has crashed (see experiment.log for details) |
|
timeout |
when the participant has exceeded the set time limit |
|
inactive |
the subject was disconnected from the experiment for too long, so the experiment was halted |
|
failure (refund) |
a connection was not able to be established within 2 minutes, so the experiment was halted and the credits were automatically refunded. |
Inputs file
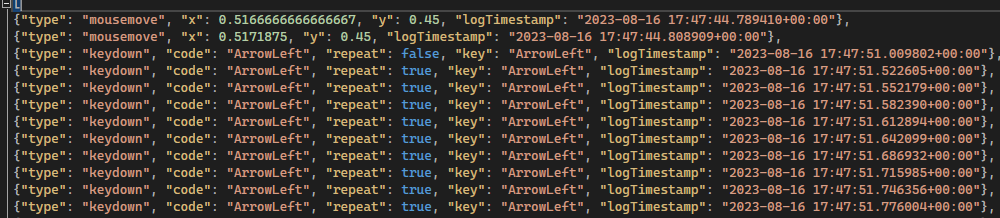
The inputs file contains a list of all mouse and keyboard events recorded by Pack&Go during the experiment.
Mouse events
Mouse events have the following format:
{"type": "mousemove", "x": 0.45185185185185184, "y": 0.10987654320987654, "logTimestamp": "2024-02-08 16:25:46.255949+00:00"}
Below is a table describing each field and its parameters.
|
Field |
Definition |
Units/Options |
|---|---|---|
|
type |
The type of mouse event detected |
mousemove, mouseup, mousedown |
|
x |
The x-coordinate of the mouse position |
normalized screen units, from 0-1 where 0 = left and 1= right |
|
y |
The y-coordinate of the mouse position |
normalized screen units, from 0-1 where 0 = top and 1 = bottom. |
|
logTimestamp |
The timestamp of the event |
Year-Month-Day HH:MM:SS.SSSSS |
Mouse presses and releases are reported whenever they are detected. Currently, only mouse activity from the left button is recorded. Mouse movement is detected at a sampling rate of 250ms. If a change in position is detected, the mousemove event is reported and the current position of the mouse is provided.
logTimestamps are always in GMT.
Keyboard events
Keyboard events have the following format:
{"type": "keydown", "code": "ArrowRight", "repeat": false, "key": "ArrowRight", "logTimestamp": "2024-02-20 15:53:34.135038+00:00"}
Below is a table describing each field and its parameters.
|
Field |
Definition |
Units/Options |
|---|---|---|
|
type |
The type of keyboard event detected |
keyup, keydown |
|
code |
The code of the key associated with the event |
all standard keyboard keys |
|
repeat |
indicates whether there was no change from the previous key-press state |
True, false |
|
logTimestamp |
The timestamp of the event |
Year-Month-Day HH:MM:SS.SSSSS |
Keyboard presses and releases are reported whenever they are detected. LogTimestamps are always in GMT.
Stream file
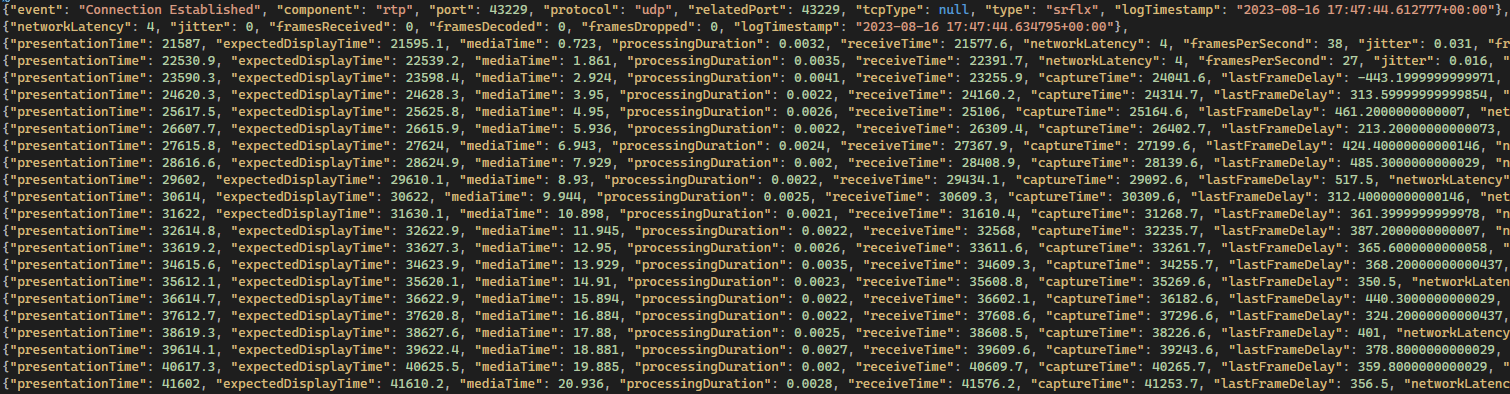
The “stream.json” file contains a number of measurements pertaining to streaming metadata, taken at a sampling frequency of 1Hz. Note, the contents of the file (which variables are available) depends on your browser. If you would like to analyze these variables in relation to events in your experiment (e.g. the stimulus onset or subject responses of each trial) you will need to record timestamps of these events in your experiment script and determine which measurements/samples align with these events. You may need to interpolate between measurements for events that fall between successive samples.
Below is a list of various measurement variables, available in Google Chrome:
|
Field |
Definition |
Units/Options |
|---|---|---|
|
event |
Indicates the established connection time, along with timestamp and other network metrics. |
Year-Month-Day HH:MM:SS.SSSSS, GMT |
|
presentationTime |
the time at which a new video frame is ready for presentation |
Milliseconds |
|
expectedDisplayTime |
the time at which the new video frame is expected to be presented, accounting for screen refresh |
Milliseconds |
|
mediaTime |
a running timer of the time since the stream started |
Seconds |
|
processingDuration |
for diagnostics by our technical support staff |
- |
|
receiveTime |
for diagnostics by our technical support staff |
- |
|
captureTime |
for diagnostics by our technical support staff |
- |
|
lastFrameDelay |
the end-to-end latency between the time in which the frame is prepared by the code and when it is displayed on the user’s side. This is the most useful for determining when a stimulus was actually presented to the participant. |
Milliseconds |
|
networkLatency |
amount of time the data takes to transfer across the network |
Milliseconds |
|
framesPerSecond |
the refresh rate of the session |
Hz |
|
jitter |
the variation in the latency of packet flow between the server and the browser; high values indicate an unstable network connection |
Seconds |
|
framesReceived |
for diagnostics by our technical support staff |
- |
|
framesDecoded |
for diagnostics by our technical support staff |
- |
|
framesDropped |
the number of dropped video frames |
Count |
|
logTimeStamp |
the time at which the measurements in the line were taken (server side) |
Year-Month-Day HH:MM:SS.SSSSS, GMT |