The I/O Configuration Page
The Simulator interface is designed to facilitate running experiments on a virtual VPixx device, which will provide the same results as a real device. Once you have selected a device, the default screen is the I/O Configuration page.

-
Device Type
-
Analog IO Clickable Shortcut
-
Digital Output IO Clickable Shortcut
-
Digital Input IO Clickable Shortcut
-
Selection of specific IO (explained below)
-
Start/Stop Signals
-
Port Choice: same as using buttons 2, 3 and 4
-
Connected Virtual Accessory
-
Signal Generator (refer to the Analog Input (ADC) & waveform Generator section)
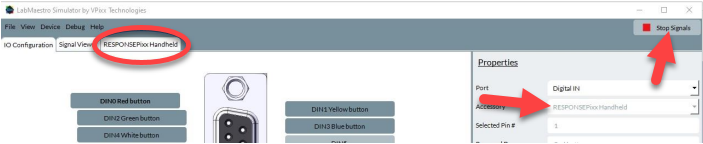
The main screen allows you to configure your virtual device. Each IO can be selected and configured individually. Once you reach this screen, your virtual device is turned on, but none of the signals are started. You must use the Start/Stop Signal button to begin. If you select an accessory, a new tab will be shown once the signals are started, as can be seen below.
The menus at the top of the window give you access to the project management options, the device settings and allow you to restore any closed views.
The Signal Viewer
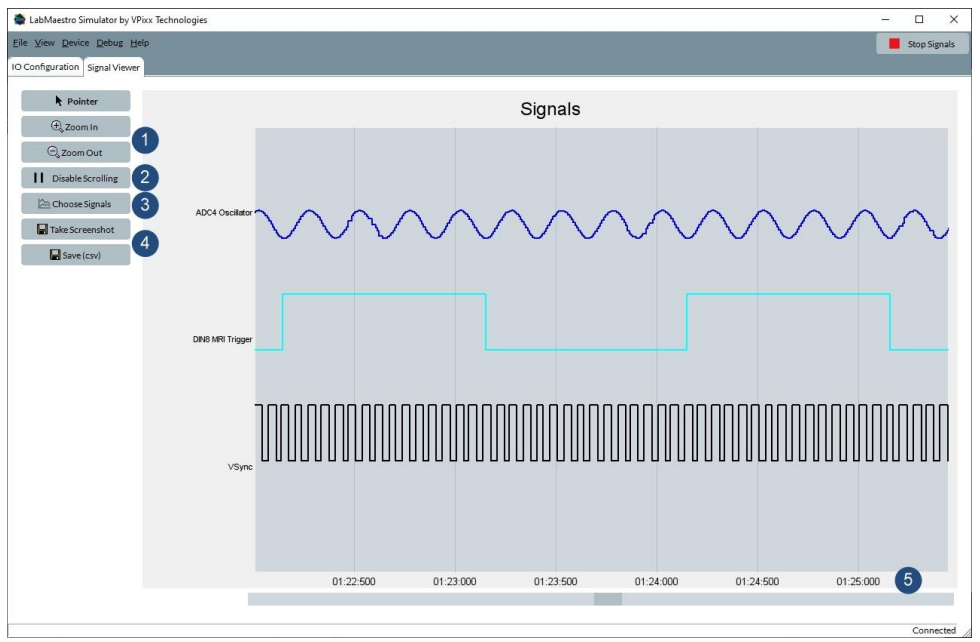
The signal viewer is a tool to preview any kind of signal sent or received by a VPixx device. If your code generates triggers, the graph will show you the real-time states of all the inputs and outputs of your device.
-
Zoom In/Out buttons
-
Enable/Disable Scrolling
-
Open the signal picker interface
-
Save the data (or a screenshot)
-
Device timeline
The zoom in and zoom out buttons transform your cursor into a magnifier to change the timeline of the graph to include a smaller or bigger portion of the data. This can also be accomplished using your mouse’s scroll wheel.
When you click on the Disable scrolling button, the graph will remain at the current time, such that you can observe the current values. Scrolling can be enabled by pressing this button, or by using the scrollbar and bringing it to the right of the graph (in other words, bring it to the current time).
You can save either the full set of data recorded so far by saving to csv file (clicking on the Save (csv) button), which will open a menu to save the file, or save only the currently shown data by clicking on the Take Screenshot button.
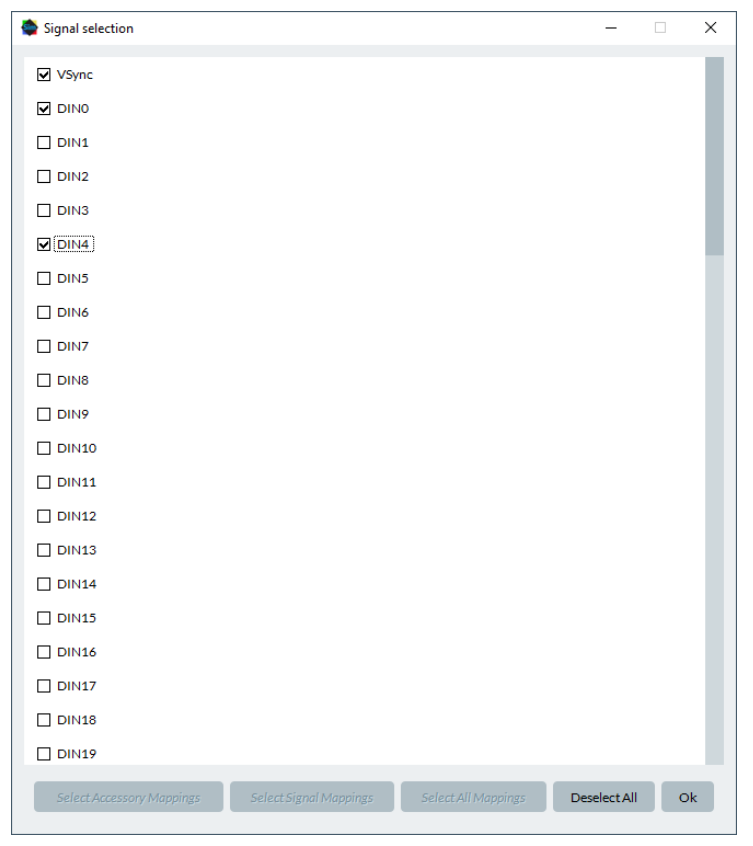
The Choose Signals button opens the Signal Selection window which allows you to select which signals to display. At the bottom, there are shortcut to select relevant signals.
Accessory Viewer
The accessory viewer is an interactive widget which simulates different RESPONSEPixx devices.
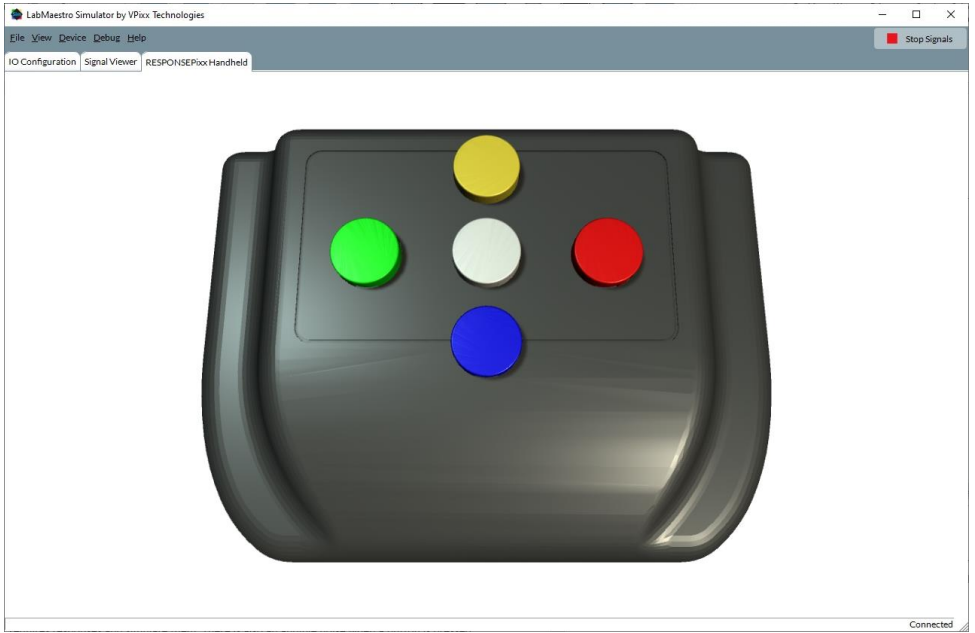
Every button is dynamic and can be pressed. This allows you to run an experiment and simulate responses. The accessory viewer generates an audible noise when a button is pressed.
Buttons may also be toggled on and off by holding CTRL and pressing keys on your keyboard numpad.
Device and Applications Settings
Accessed via the main menu (File -> Settings), four categories of settings currently exist: Application, Device, Pixel Mode and Pixel Sync Mode

The Application widget allows you to Display Pin Numbers (relevant if you want to move some cabling to a real device). Mute all Sound disables the RESPONSEPixx clicking noises, such as not to interfere with experience-relevant sounds.

The Device widget allows you to give your device a Custom Device Name, control the Video Refresh Rate and check or uncheck the Digital Loopback Enabled box (this can also be done via the normal API).