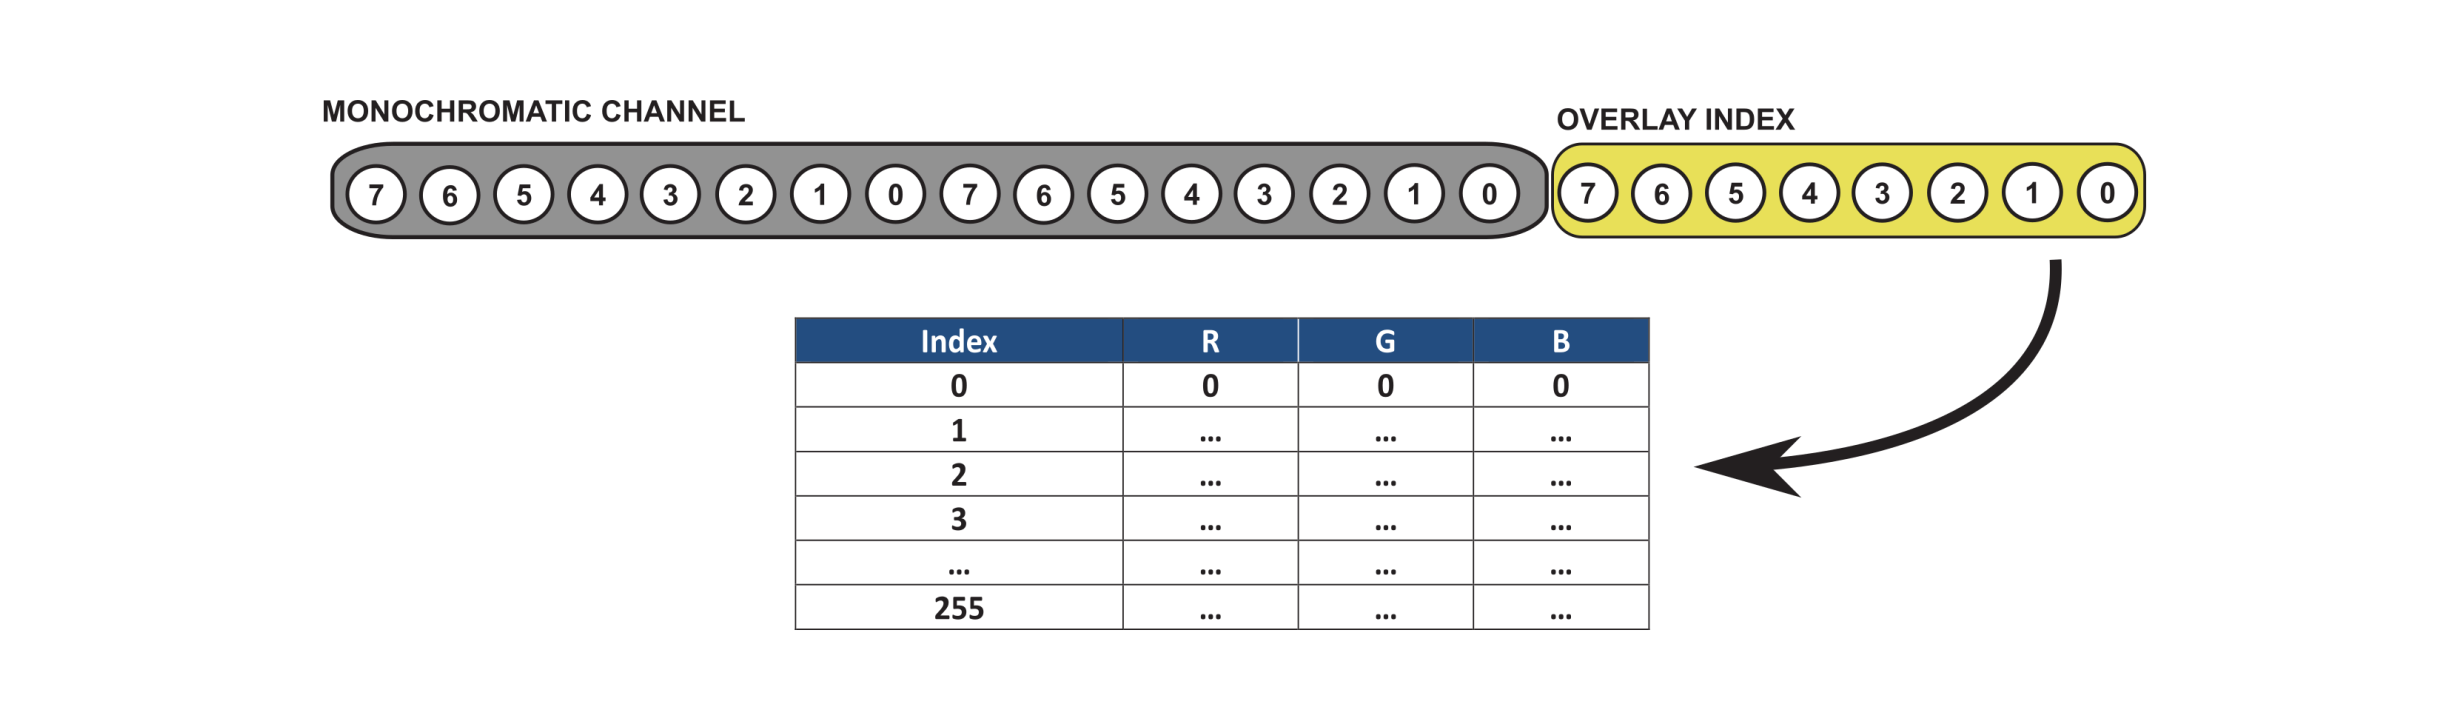
M16 allows the user to display in high-bit-depth grayscale, at any supported resolution (e.g., full HD 1920 x 1080) and 120 Hz refresh. It works by reassigning the 8 bits of the red and green colour channels of a given pixel as a single 16-bit greyscale output.
The remaining 8 bits of the blue colour channel may be optionally used to index a user-defined 256 x 3 CLUT containing 16-bit R, G and B pixel values. Images assigned to a row in this table will be drawn in the designated colour as an overlay on the main greyscale image.
To use M16 mode you will need to ensure your image drawing software is capable of specifying 16-bit values. In MATLAB, the PsychImaging tools available through Psychtoolbox include a function to instruct drawing commands to use 32-bit floating point values. Enabling this setting allows users to exceed the standard 8 bpc colour value assignment. In Python/PsychoPy, you can specify the bit depth when opening a window using the ‘visual.Window’ class, by setting the depthBits argument (e.g. depthBits = 16, in this case).
Examples
Drawing a grey rectangle in M16 mode (MATLAB/Psychtoolbox)
Note this example requires the use of Psychtoolbox for MATLAB. The first step is to enable 16-bit encoding and M16 using wrapper commands in PsychImaging. Then we can assign a single 16-bit grey value, expressed as a proportion of the maximum (e.g., from 0-1), to the drawing commands available with the Screen() function.
%Establish the correct colour and video settings
AssertOpenGL;
PsychImaging('PrepareConfiguration');
PsychImaging('AddTask', 'General', 'FloatingPoint32Bit');
PsychImaging('AddTask', 'General', 'EnableDataPixxM16OutputWithOverlay');

%If using the PROPixx - uncomment the following to change the sequencer
%for linearized output (trades off luminance). Make sure to reset to 0 at
%the end of your script.
%Datapixx('SetPropixxDlpSequenceProgram', 6);
%Datapixx('RegWr');

%Open a full-screen window with a black background
screenNumber = max(Screen('Screens'));
[win, winRect] = PsychImaging('OpenWindow', screenNumber, [0,0,0]);

%Determine our target gray value as a proportion of the maximum possible value
max16BitGray = 65535;
myGrayLevel = 1026/max16BitGray;

%Draw our rectangle in the top left corner of the window and flip
Screen('FillRect', win, myGrayLevel, [0, 0, 400, 400]);
Screen('Flip', win);
Drawing a grey rectangle in M16 mode (Python/PsychoPy)
Note this example requires the use of the PsychoPy library for Python. The first step is to enable 16-bit encoding, when opening the window by specifying “depthBits = 16” in the “visual.Window” class in PsychoPy, and setting up our shader for M16 mode. Then we can assign a single 16-bit grey value, expressed as a proportion of the maximum (e.g., from 0-1), when defining our square stimulus using the “visual.Rect” class in PsychoPy.
#import all necessary modules and libraries
from psychopy import core, visual
from psychopy.hardware import keyboard
from pypixxlib import _libdpx as dp
from pypixxlib import shaders
import numpy as np

from pypixxlib.propixx import PROPixx #comment out if you are using a VIEWPixx
#from pypixxlib.viewpixx import VIEWPixx #uncomment if you are using a VIEWPixx

myDevice = PROPixx() #comment out if you are using a VIEWPixx
#myDevice = VIEWPixx() #uncomment if you are using a VIEWPixx

kb = keyboard.Keyboard()

#initialization steps
dp.DPxOpen()

#set the device in M16 mode
myDevice.setVideoMode('M16')

dp.DPxSetPPxDlpSeqPgrm('RGBHBD') #set RGB high bit depth sequencer mode;
#do this when displaying on PROPixx to maintain linearity, gamma = 1.
#Otherwise, comment this line out
dp.DPxWriteRegCache()

#choose a 16-bit intensity value
max16BitGray = 65535
myGrayLevel = 1026/max16BitGray

#open a full screen window with a black background
win = visual.Window(
        screen = 1,
        monitor =None,
        fullscr=True,
        color='black',
        units = "pix",
        useFBO = True,
        colorSpace='rgb1',
        depthBits=16   #specify bit depth as 16-bit
        )


#setup the shader for M16 mode
shaders.setUpShaderAndWindow(myDevice, win)

#Define the square stimulus with desired 16-bit gray level
square = visual.Rect(
    win=win,
    size=400,
    pos=[0, 0],
    colorSpace='rgb1',
    fillColor = myGrayLevel
)

#continue drawing/displaying the square until the user presses 'escape'
while True:
    square.draw()
    win.flip()

    # Check for escape key press; exit program if 'escape' is pressed
    keys = kb.getKeys()
    if 'escape' in keys:

        break

#set videomode back to default, 'C24', and close the window
dp.DPxSetVidMode('C24')
dp.DPxWriteRegCache()
win.close()
core.quit()
Adding a 16-bit colour overlay (MATLAB/Psychtoolbox)
The following example builds off of example 1. Here we are adding code to generate some blue text as an overlay.
To add colour as an overlay, we must first define a CLUT, and open a special overlay window using Psychtoolbox commands. Then we will draw our text to the overlay window with the appropriate index to our lookup table. Note that the lookup table is expecting RGB values with 16 bpc (i.e., 0-65535 levels, expressed as a proportion from 0-1).
On Windows, due to PTB’s scaling methods, row 1 is ignored. Row 2 is indexed as 1, Row 3 as 2, etc. The MATLAB example below demonstrates this.
%Generate our colour look-up table (CLUT) for our main display.
%CLUT values are 0-1; the output is 16 bit (0-65535).

%!! ON WINDOWS!!
% PTB scales colour by 255/256, therefore CLUT counting starts at the second row.
% See example below.

%!! ON OS-X !!
%CLUT assignment seems to have issues with mapping onto CLUTs. Consider making multiple (~5) rows
%The same colour and calling the middle row to ensure a buffer.

%The clut is first populated with black and then the first two rows are changed to blue and red
myTable=repmat([0,0,0], [256,1]);
myTable(2,:) = [0,0,1]; %Row 1 in Windows
myTable(3,:) = [1,0,0]; %Row 2... etc
Datapixx('SetVideoClut', myTable);
Datapixx('RegWr'); %straight calls to our Datapixx API require an explicit register write or update

%Get our overlay window
overlay = PsychImaging('GetOverlayWindow', win);

%Turn off antialiasing, since it can create strange effects when using CLUTs
Screen('Preference', 'TextAntiAliasing', 0);

%Let's put some blue text in the overlay. The last argument here is the index of our lookup table
DrawFormattedText(overlay, 'Here is some text', 'center', 40, 1);
Screen('Flip', win);
Using a DATAPixx3 with a third-party display? You can still use the overlay feature. Simply follow the same procedure above; the DATAPixx3 will pass 8-bit instead of 16-bit values to the display.
Adding a 16-bit colour overlay (Python/PsychoPy)
The following example builds off of example 1. Here we are adding code to generate some blue text as an overlay.
To add colour as an overlay, we must first define a CLUT, load the CLUT to our VPixx device, and then specify that we will use overlay when setting up our shader for M16 mode, by setting the overlay argument to “overlay = True”. Then we will draw our text to the overlay window with the appropriate index to our lookup table. Note that the lookup table is expecting RGB values with 16 bpc (i.e. values from 0-65535).
#import all necessary modules and libraries

from psychopy import core, visual
from psychopy.hardware import keyboard
from pypixxlib import _libdpx as dp
from pypixxlib import shaders
import numpy as np

from pypixxlib.propixx import PROPixx #comment out if you are using a VIEWPixx
#from pypixxlib.viewpixx import VIEWPixx #uncomment if you are using a VIEWPixx

myDevice = PROPixx() #comment out if you are using a VIEWPixx
#myDevice = VIEWPixx() #uncomment if you are using a VIEWPixx

kb = keyboard.Keyboard()

#initialization steps
dp.DPxOpen()

dp.DPxSelectDevice('Auto')

#define the CLUT. The CLUT is first populated with black and then the first two rows
#are changed to blue and red
myTable = np.zeros((3, 256),dtype=np.uint16)
myTable[:,1] = [0,0,65535]
myTable[:,2] = [65535,0,0]

#load the CLUT on the device
dp.DPxSetVidClut(myTable)
dp.DPxWriteRegCache()

#set the device in M16 mode
myDevice.setVideoMode('M16')

dp.DPxSetPPxDlpSeqPgrm('RGBHBD') #set RGB high bit depth sequencer mode;
#do this when displaying on PROPixx to maintain linearity, gamma = 1.
#Otherwise, comment this line out

dp.DPxWriteRegCache()

#open a full screen window with a black background
win = visual.Window(
        screen = 1,
        monitor =None,
        fullscr=True,
        color='black',
        units = "pix",
        useFBO = True,
        colorSpace='rgb1',
        depthBits=16
        )

#setup the shader for M16 mode, specifying that we wish to use overlay mode
shaders.setUpShaderAndWindow(myDevice, win, overlay = True)

#define the text stimulus to draw, with the color's blue channel set to the index
#of the target color in the CLUT
text = visual.TextStim(
    win = win,
    text = 'Here is some text',
    pos = [0,500],
    colorSpace='rgb255',
    color = [0,0,1],
    antialias=False
)

#continue drawing/displaying the text until the user presses 'escape'
while True:
    text.draw()
    win.flip()

    # Check for escape key press; exit program if 'escape' is pressed
    keys = kb.getKeys()
    if 'escape' in keys:

        break

#set videomode back to default, 'C24', and close the window
dp.DPxSetVidMode('C24')
dp.DPxWriteRegCache()
win.close()
core.quit()
Adding “hidden content” to the experimenter console
This example builds off the previous two examples.
In a typical VPixx setup, there is a second monitor connected to the Video Out 2 or Console Out port on the VPixx hardware. This second “console” monitor always shows a copy of the video to the stimulus display.
Because this view is a copy of the video signal, it does not put any additional pressure on the control PC’s graphics card. It is therefore ideal as an experimenter’s view during data collection. However, it cannot show unique material to the experimenter unless a special video mode is used.
For example, a researcher might want to keep track of participant performance on their console display, but hide this information from the participant. The PLDAPs Toolbox (pronounced “platypus”) by Eastman and Huk [1] uses this strategy to show real-time eye tracking data and trial metadata on the console during experiments.
To add unique content to the console, we must:
-
Define a colour which the hardware should ignore (a ‘transparency’)
-
Create a second 256 x 3 16-bit RGB CLUT for the console monitor
-
Populate the main display CLUT with transparencies in designated rows, where the corresponding row in the console CLUT contains a non-transparency colour
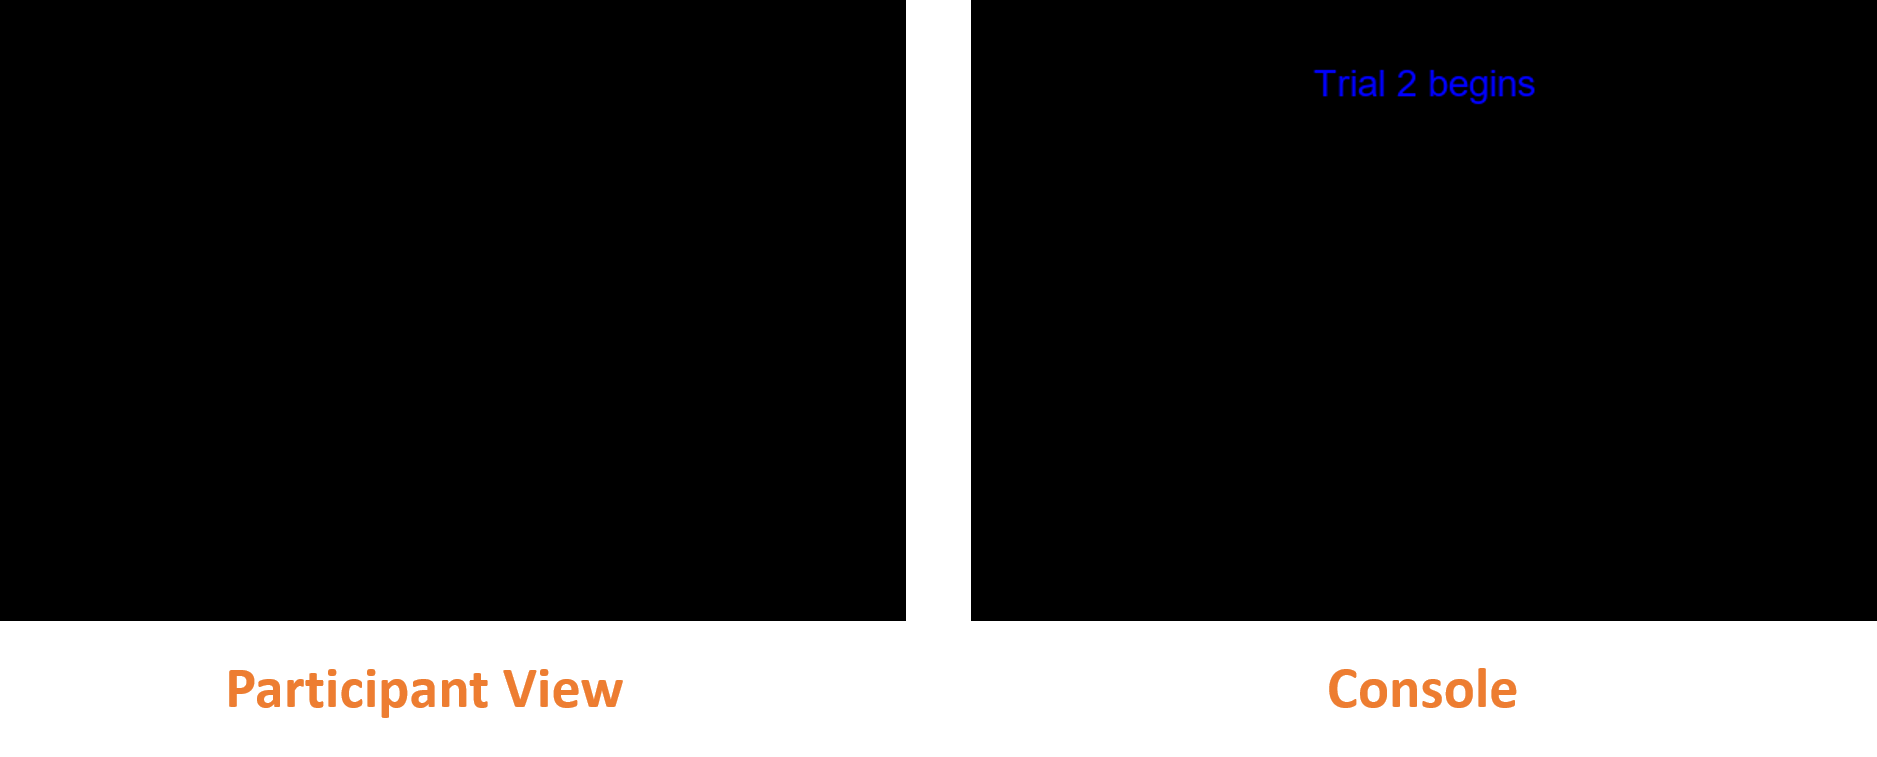
When drawing content to the overlay, we index a single row that invokes the stimulus display CLUT and the console display CLUT on respective monitors. In this case, the overlay text is ignored on the stimulus display but shown on the console.
MATLAB/Psychtoolbox Example
%Let's set an arbitrary transparency colour of full green
myTransparency = [0,1,0];
Datapixx('SetVideoClutTransparencyColor', myTransparency);
Datapixx('EnableVideoClutTransparencyColorMode');
Datapixx('RegWr');

%Create a copy of the first CLUT and populate row three with our transparency (stimulus display)
%and full blue (console)
myConsoleTable = myTable;
myTable(3,:) = myTransparency; %Row 2 in Windows
myConsoleTable(3,:) = [0,0,1]; %Row 2 in Windows

Datapixx('SetVideoClut', [myTable; myConsoleTable]);
Datapixx('RegWr');

%Draw our text with index 3
DrawFormattedText(overlay, 'Trial 2 begins', 'center', 40, 2);
Screen('Flip', win);
Python/PsychoPy Example
#import all necessary modules and libraries

from psychopy import core, visual
from psychopy.hardware import keyboard
from pypixxlib import _libdpx as dp
from pypixxlib import shaders
import numpy as np

from pypixxlib.propixx import PROPixx #comment out if you are using a VIEWPixx
#from pypixxlib.viewpixx import VIEWPixx #uncomment if you are using a VIEWPixx

myDevice = PROPixx() #comment out if you are using a VIEWPixx
#myDevice = VIEWPixx() #uncomment if you are using a VIEWPixx

kb = keyboard.Keyboard()

#initialization steps
dp.DPxOpen()

dp.DPxSelectDevice('Auto')

#Enable M16 mode on the device
dp.DPxSetVidMode('M16')

dp.DPxSetPPxDlpSeqPgrm('RGBHBD') #set RGB high bit depth sequencer mode;
#do this when displaying on PROPixx to maintain linearity, gamma = 1.
#Otherwise, comment this line out
dp.DPxWriteRegCache()

#set the transparency value
myTransparency = [0,65535,0]
dp.DPxSetVidClutTransparencyColor(myTransparency[0],myTransparency[1],myTransparency[2])

#enable transparency color mode on the device
dp.DPxEnableVidClutTransparencyColorMode()
dp.DPxWriteRegCache()

#define the main display CLUT. The CLUT is first populated with black and
#then the first three rows are changed to the transparency color
myTable = np.zeros((3, 256),dtype=np.uint16)
myTable[:,1] = myTransparency
myTable[:,2] = myTransparency
myTable[:,3] = myTransparency

#create a CLUT for the console display
myConsoleTable = myTable.copy()

#change the third CLUT entry to contain the color of the stimulus that
#appears exclusively on the console display
myConsoleTable[:,3] = [0,0,65535]

#write the main and console display CLUTs to the device
CLUTS = np.hstack((myTable,myConsoleTable))

dp.DPxSetVidCluts(CLUTS)
dp.DPxWriteRegCache()

#open a full screen window with a black background
win = visual.Window(
        screen = 1,
        monitor =None,
        fullscr=True,
        color='black',
        units = "pix",
        useFBO = False,
        colorSpace='rgb1',
        depthBits=16,
        multiSample=False,  # Disable MSAA
        numSamples=0  # Ensure 0 samples
                )

#setup the shader for M16 mode, specifying that we will use the overlay mode

shaders.setUpShaderAndWindow(myDevice, win, overlay = True)

#define the text stimulus to draw, with the color's blue channel set to the
#index of the target color in the console CLUT

text2 = visual.TextStim(
    win = win,
    text = 'Trial 2 begins',
    pos = [0,500],
    colorSpace='rgb255',
    color = [0,0,3],
    antialias=False
)

#continue drawing the text stimulus until the user presses the 'escape' key
while True:
    text2.draw()
    win.flip()

    # Check for escape key press; exit program if 'escape' is pressed
    keys = kb.getKeys()
    if 'escape' in keys:
        dp.DPxUpdateRegCache()
        break


#set the device back to the default, C24, video mode and close the window

dp.DPxSetVidMode('C24')
dp.DPxWriteRegCache()
win.close()
core.quit()
Transparency colours can also be used in the console lookup table if you want to do the reverse of this example and show something only on the stimulus display instead.
For more examples of M16 mode, please see our demo on Understanding CLUTs, M16 Mode, and Color Transparency.
Blending, interpolating and antialiasing can cause strange results when using CLUTs. It is best to avoid these in our high bit depth modes like M16. See What is Pixel Identity Passthrough? for more details.
References
[1] Eastman, KM. and Huk, AC. (2012) PLDAPS: a hardware architecture and software toolbox for neurophysiology requiring complex visual stimuli and online behavioural control. Front. Neuroinform. 6:1. doi: 10.3389/fninf.2012.00001