In order to run this tutorial, you must first install the i1.mex file for your device. Otherwise, you will receive an error.
The file should have been provided to you at the time of purchase. If you require a copy, please contact our support team at support@vpixx.com with your invoice number.
To install your i1.mex file, follow the same procedure as for our standard library, Datapixx.mex. See this page for more details: https://docs.vpixx.com/matlab/introduction-to-vpixx-matlab-documentation
First, because operating temperature influences the luminance of a display, ensure that the display you want to linearize has reached a stable operating temperature. This information can typically be found in the user manual of your display. For example, VPixx Technologies strongly recommends that a VIEWPixx display should be operated at an ambient room temperature between 20°C and 28°C. The optimal display uniformity is obtained after a warm-up period of around 20 minutes. Ideally, the screen will be warmed up while displaying a full-white screen, as this will drive the highest amount of current through the electronic components. This should be taken into consideration before taking photometric measurements and before running experiments. After warm-up, the measurements made on a given luminance patch should remain stable over time.
When you are ready, download the tutorial materials and open the i1D_SampleLuminance.m MATLAB script. Install your calibration device according to the instructions in its user manual, and connect it to a USB port with sufficient power supply.
In this script, luminance measurements will be made on a series of monotonically increasing greyscale luminance patches which will be visible for a few seconds at a time.
There are three variables that you may want to modify:
%% User set variables are:
ModeMeasure = 'sample'; %'linearize'
nPatches = 32; % 32 luminance patches will be measured
preparationTime = 5; % 5 seconds
When you first execute i1_SampleLuminance.m in MATLAB, ModeMeasure should be set to ‘sample’. This will ensure that all luminance measurements are made on an uncorrected visual display.
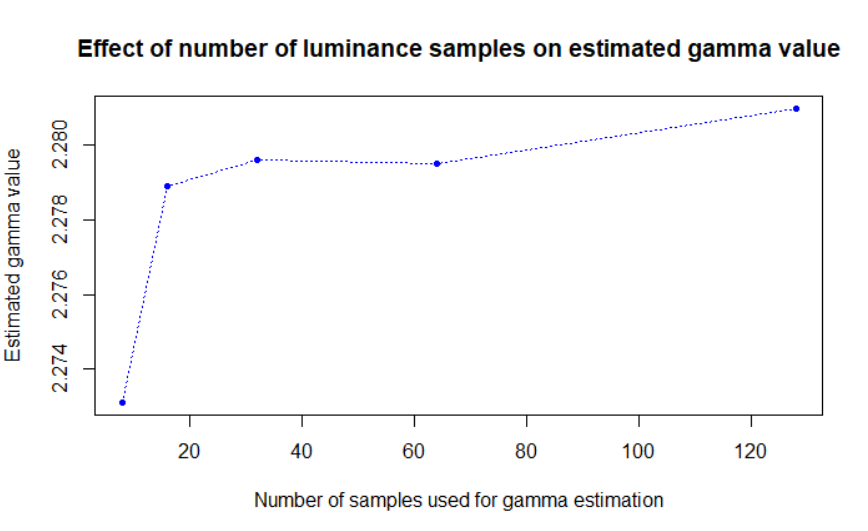
By default, the script will execute with nPatches = 32. You can modify this value as desired, as long as you keep a large enough number of patches to adequately estimate the power function coefficient.
When you first execute the script, you will have 5 seconds to confirm that the measurement device is setup on the screen and that the lights of the room are turned off. You can shorten or lengthen this duration by editing preparationTime.
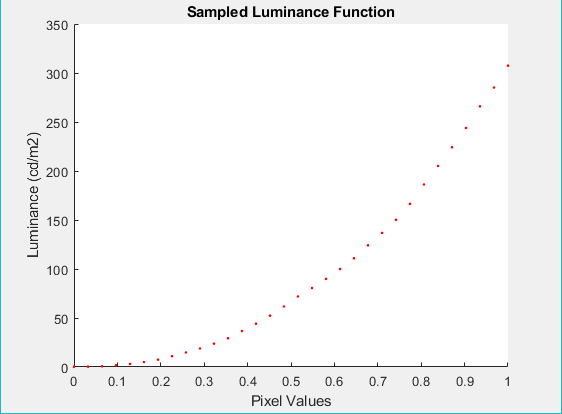
When the script is concluded a figure will be produced and will show you the sampled luminance (in candelas per square meter) as a function of the linearily-spaced programmed pixel values. It should be obvious that the luminance data is highly non-linear. A file with intermediary results will be saved under the name ‘mySampledLuminance.mat’, containing normalizedLum, the zero-corrected and normalized luminance data, as well as PatchesPixels, the original pixel values used to produce each luminance patch.