This guide is an introduction to using the X-Rite i1Display Pro colorimeter or the X-Rite i1 Pro spectrophotometer to linearize the luminance of a visual display. You will use a MATLAB script to sample the luminance of a display at various pixel values, characterize and gamma-correct the non-linearity of your display.
To store an image on a computer, the image data is broken down into smaller ‘picture elements’ called pixels. Each pixel represents one colour in a specific location of the screen. An image presented on a full high-definition screen (i.e., 1920 x 1080) will contain millions of these pixels. The pixels are encoded in terms of an RGB triplet. The higher the pixel value, the greater the measured luminance.
Vision scientists attempt to characterize the relationship between the physical properties of a stimulus and its visual perception and expect to find that pixel value would be linearly related to luminance.
The Commission Internationale de l’Eclairage (CIE) defines luminance as a measurement of luminous intensity radiating from a surface, weighted by the sensitivities of human photoreceptors wavelengths in the visible light spectrum, expressed in candelas per square meter (cd/m2).
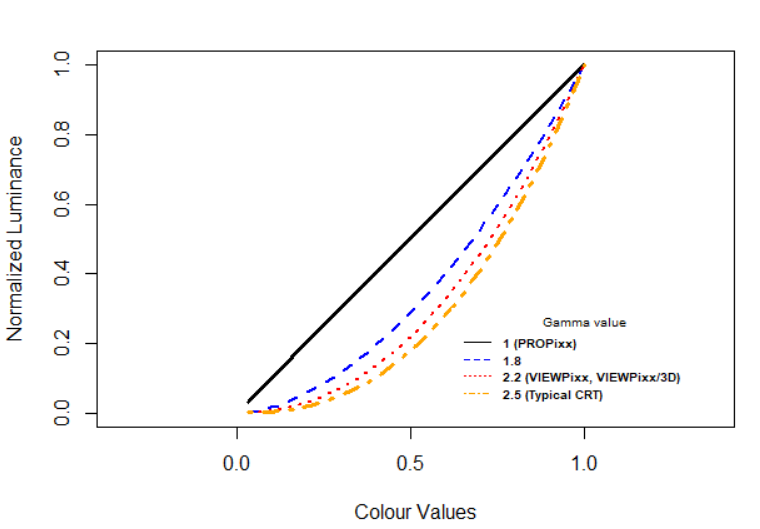
However, it is not typically the case: the relationship between pixel value and luminance typically follows a positive power function of the form y = xγ, where y is the normalized luminance value, x the pixel value, and gamma (γ) is the power that characterizes the relationship between the two values.
Historically, cathode-ray tube screens (CRTs) were the first types of screens used to visualize video content, and different luminance levels were produced by varying the number of electrons fired from an electron gun. This electron gun responded to voltage input according to a power function of 2.5, known as gamma.
Other display technologies are also non-linear, such as the LCD panels of commercial displays, but also those of the VIEWPixx and VIEWPixx/3D screens. Here are some examples of gamma in visual displays used in vision research:
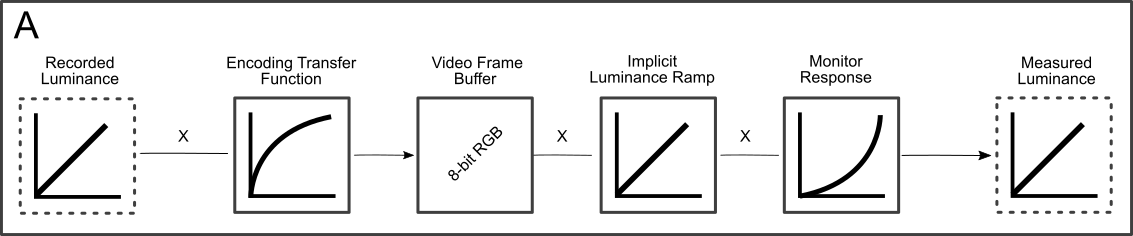
This non-linear relationship happens to have a very useful practical application in video recording. Indeed, the amount of information that can conveyed through a video signal is typically rather limited, where each colour of an RBG triplet is encoded with 8 bits of information. In other words, the specific amount of red, green and blue of a given pixel can only be set at one of 2^8 = 256 levels, between the minimum and maximum luminance level that a screen can display. However, humans are much more sensitive to small increases of light at low-luminance levels, than they are to similar increases of light at high-light levels. If the relationship between the colour value and the luminance was perfectly linear, then most of the bits used to encode the high-luminances would be essentially wasted, since viewers could not tell the difference between the different values, while there might be very obvious differences at the low-light levels.
It turns out that a CRT response is almost exactly the inverse of human lightness sensitivity, a property that can be neatly exploited in computer graphics. In the early days, it was recognized that if video data was recorded with a transfer function that compresses video signal to maximize human perception, then the CRT could be used to essentially ‘decompress’ the signal, without requiring any further transformation on the video signal. The general principle behind video compression is still used today. Sequence A, below, illustrates the associated process.
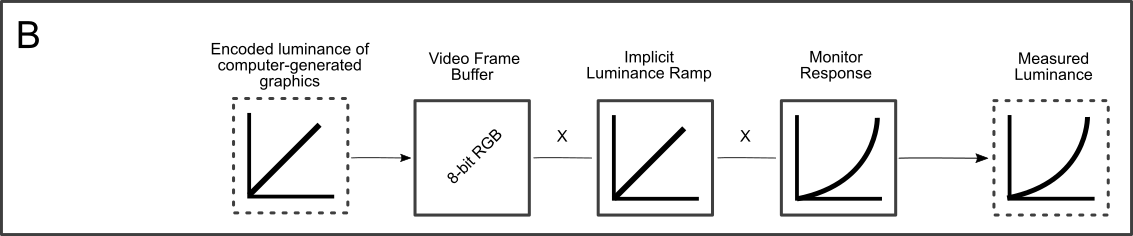
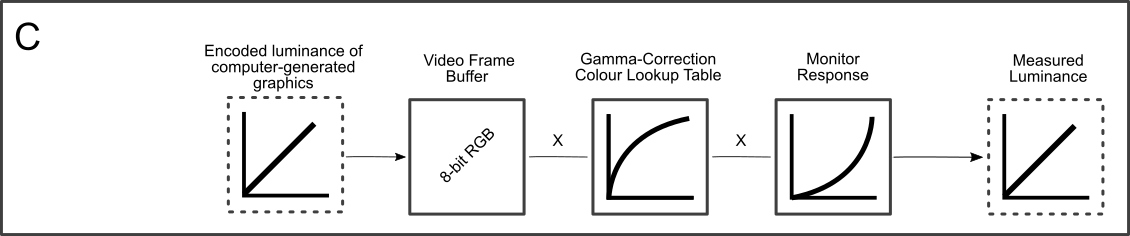
As vision scientists, we typically generate entirely new images and wish to send them directly to the graphic card’s video buffer. However, as seen in Sequence B, below, bypassing an encoding transfer function means that the monitor’s gamma will de-linearize our stimuli, greatly altering our intended stimulus.
For vision scientists, the simplest and most computationally efficient method of applying a gamma correction to our monitor, i.e., of compensating for the monitor’s non-linear response, is to instruct the graphics card to modify the relationship between the pixel input value and the signal that is actually sent to the monitor. To do so, it is possible to apply a custom gamma-correction colour lookup table (gamma-correction CLUT) that is the inverse of the monitor’s gamma.
A colour lookup table (CLUT) is essentially a matrix that converts (or remaps) a pixel value input to a different output, according to your own preference. For an 8-bit RGB video signal, such as the signal typically sent to a VIEWPixx/3D or a VIEWPixx, the CLUT will always take the form of a 28 = 256 row by 3 column matrix, where the rows represent each of the possible colour values the signal can contain, and where the columns correspond to the red, green and blue components of the video signal. For example, in MATLAB and Psychtoolbox, it is expected that each of the cells contains a decimal number ranging from 0 to 1. When applied by the software, this value is converted to a format usable by the display device. On VPixx hardware, this decimal number is stored internally as a 16-bit int.
By default, for each of the 256 levels of an 8-bit video signal, the implicit luminance ramp contains linearly increasing values, uncompensated for any non-linearity in the monitor:
|
IMPLICIT LUMINANCE RAMP |
|||
|---|---|---|---|
|
VIDEO SIGNAL |
RED |
GREEN |
BLUE |
|
0 |
0 |
0 |
0 |
|
1 |
0.0039 |
0.0039 |
0.0039 |
|
2 |
0.0078 |
0.0078 |
0.0078 |
|
3 |
0.0118 |
0.0118 |
0.0118 |
|
… |
… |
… |
… |
|
254 |
0.9961 |
0.9961 |
0.9961 |
|
255 |
1 |
1 |
1 |
Attention! In this tutorial, we assume that no other modification is made to the CLUT. This tutorial may not be compatible with some special VIEWPixx and PROPixx video modes and sequencers that also modify CLUTs.
The crux of the problem rests on the practical difficulty of obtaining the proper inverse gamma function and using it to generate the gamma-correction CLUT that should be applied for any given experiment. There are three methods to gamma correct a display:
-
One approach is to simply use the gamma value provided by display manufacturers to generate the gamma-correction CLUT, typically 2.2. This can often be adjusted in the options of advanced graphic cards.
-
Measure luminance on greyscale luminance patches, encompassing the minimum and maximum pixel values. Apply the resulting gamma equally to all colour channels.
-
Measure luminance independently for the red, green and blue colour channel, encompassing the minimum and maximum pixel values. Apply the resulting gamma independently to all colour channels.
Practically, greyscale and colour-dependent gamma-correction CLUTs can be obtained with the same procedure:
-
Measure the luminance of your display at equally spaced pixel values, including the minimum and maximum displayed luminance of your screen. A non-linear curve would typically be obtained.
-
Fit a power function to the experimental data, plot the inverse function, and compute the gamma-correction CLUT values for each of the 256 potential RGB pixel values.
-
Apply the gamma-correction CLUT and measure the luminance of your display at equally spaced pixel values. The new measurements should now be linear.
Display non-linearity is not a new problem, and indeed, there are already several tools available online for vision scientists. Notably, for those who use MATLAB and Psychtoolbox, there exists a FitGamma function (and the associated FitGammaDemo.m) that can guide you through the greyscale gamma-correction process. However, a notable difficulty is that it depends on the Mathworks Optimization Toolbox, to which not all MATLAB users have access. The demo also uses ‘typical’ display data, and understandably, does not include the measurement procedure, as this depends on the hardware used.
With this guide, if you have purchased an X-Rite i1Pro spectrophotometer or X-Rite i1Display Pro colorimeter from VPixx Technologies, you will be able to:
-
Use MATLAB and Psychtoolbox to automate greyscale luminance measurements and plot the results.
-
Enter the data into a web app to obtain an estimate of gamma.
-
Generate and apply the associated greyscale gamma-correction CLUT in MATLAB.
-
Confirm that the new gamma-correction CLUT linearized the display luminance as expected.
Navigation