Our team has been working hard to add more features to LabMaestro, and the software is updated regularly. This guide was developed based on LabMaestro release 1.8.1. Some user interfaces may have changed since then; if you need assistance finding a feature, don’t hesitate to contact support@vpixx.com.
LabMaestro is VPixx’s high-level software for configuring VPixx hardware and designing experiments. It offers a completely code-free method of calibrating your TRACKPixx3 and collecting/visualizing gaze data. In this example, we will demonstrate:
-
Adding a customized calibration procedure to an experiment
-
Performing a short eye-tracking data collection routine
-
Performing a drift check, and optional recalibration
-
Inspecting the eye-tracking data
The LM project file for this example is here: [download]
If you use multiple displays in your LabMaestro TRACKPixx3 experiment, please set your displays to ‘extended’ rather than ‘mirrored’ mode. Mirrored displays can cause resolution issues in the current calibration settings.
Simulated vs. real eye trackers
We know lab time is precious. If you don’t have access to an eye tracker, you can still follow this tutorial using a simulated TRACKPixx3 via the LabMaestro Simulator. During simulation, your experiment treats the current mouse position as the X and Y coordinates of the “participant's” gaze.
You can run most of this tutorial using the simulated tracker, make your desired modifications, and test everything on a TRACKPixx3 when it becomes available.
.png?cb=cfe61d397f1d521335f65f2fe757635d)
You can use a simulated or a real TRACKPixx3, but not both simultaneously. Make sure to close your VPixx Device Simulator before testing with a real device.
Creating a new TRACKPixx3 project
To create a new project, select File > New (empty) from the main menu.
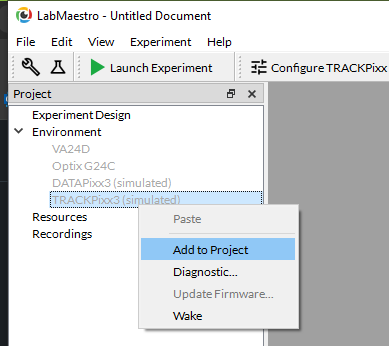
Next, add the TRACKPixx3 to your project. You can do this by right-clicking on the device in the Project Panel (under the Environment section) and selecting Add to Project from the menu:
Configuring the TRACKPixx3 device settings
Device settings refer to hardware configurations like LED lamp intensity, console overlay layout and tracking mode. For a full list see Appendix 1 of this guide.
You can configure device settings by double-clicking on the TRACKPixx3 in the Project Panel. The device settings will appear in the Timeline Workspace. Additional properties, like the device name and firmware revision, will appear in the Properties Window.
In the Device Settings, there are two columns: Project Requirements and Currently on Device. Set the requirements for your project and select Apply All to update your TRACKPixx3 settings to match.
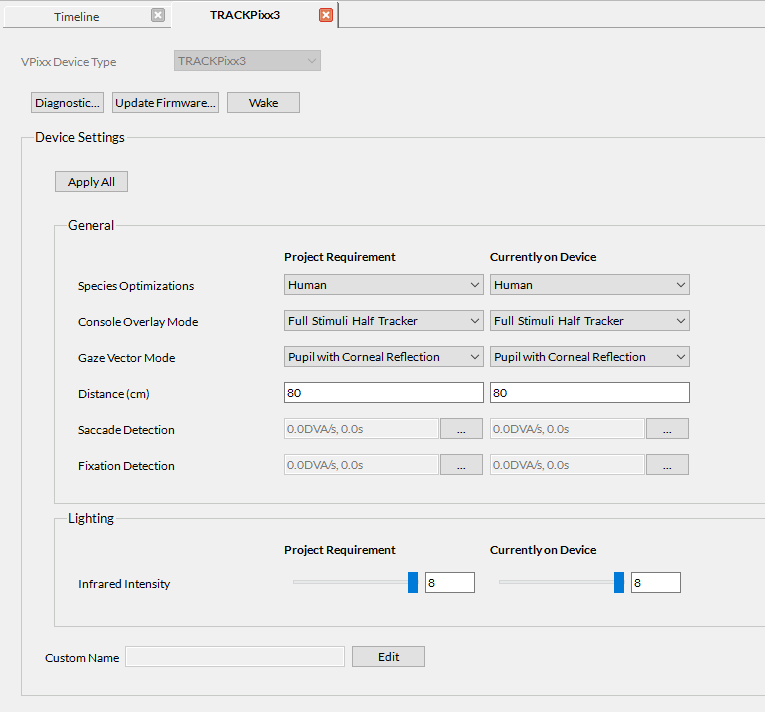
If the TRACKPixx3 attached to your project has settings that are different from those required by your project, LabMaestro will show a warning when the experiment launches and prompt you to adjust your settings.
For this tutorial, ensure you have set the correct device settings for:
-
Species (human or non-human primate)
-
Distance (from eye tracker to eyes)
-
Infrared intensity (recommended setting is 8)
Waking the camera
The TRACKPixx3 is asleep by default. To wake it, click the Wake Camera option from the header menu or right-click on the device in the Project Panel and select Wake. When the camera is awake, clicking the Configure TRACKPixx option in the header menu will show the camera’s live feed in the Timeline Workspace. Note that if you use a simulated TRACKPixx3, the Timeline Workspace will remain black.
Configuring the camera view
The live feed guides the experimenter in positioning the camera, adjusting the camera aperture and focus, adjusting the iris size, and applying search windows. For more guidance on these steps, see this section of the first page of this guide.
In LabMaestro, the iris size is adjusted with a slider above the camera feed. The search windows are enabled via a checkbox, also above the camera feed. Once enabled, the search limits can be added by clicking on the camera feed itself with the mouse.
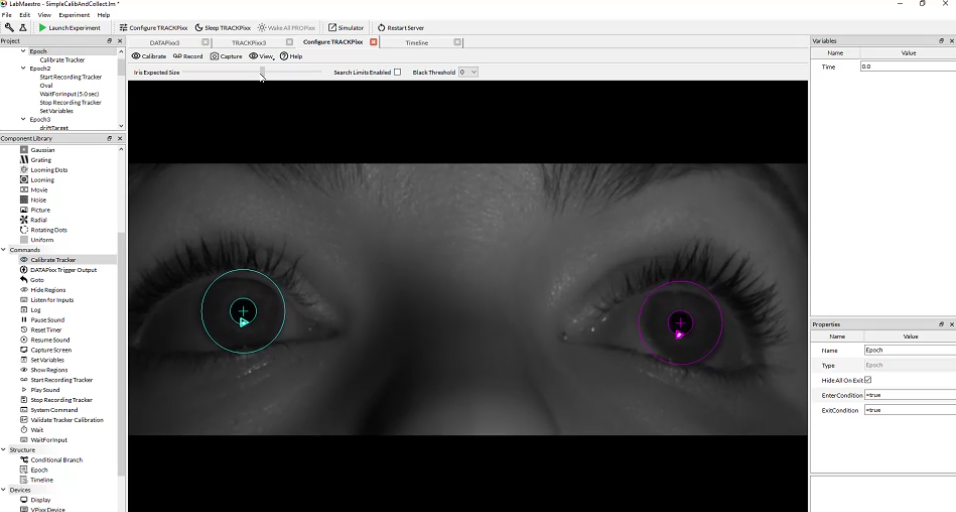
If needed, the LabMaestro interface can be dragged onto the stimulus display (participant’s screen) to facilitate camera adjustments. As mentioned in the introduction, this adjustment should be performed for each participant at the beginning of each experiment session. In the case of LabMaestro projects, this adjustment should be performed before you launch an experiment.
The View dropdown menu in the Configure TRACKPixx pane offers different visualization overlays. The Capture option allows you to take screenshots of the camera image, and the Record option toggles recording.
Implementing a gaze point calibration
There are two ways to run a calibration routine:
-
Click on Calibrate in the Configure TRACKPixx menu. This triggers a one-time calibration with a widget controlling calibration settings, like the number of targets.
-
Add a Calibrate Tracker component to your project timeline. This creates a persistent calibration routine embedded within your experiment protocol. The calibration routine's properties are managed in the component's Properties Window.
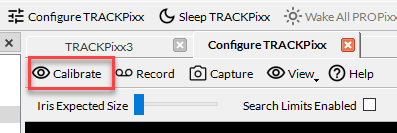
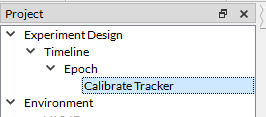
The rest of the tutorial uses the second method.
Designing a simple experiment
In this section, we walk through the creation of a LabMaestro experiment with eye tracking.
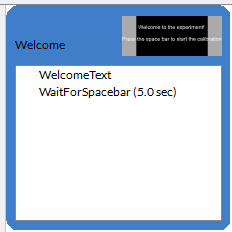
Welcome Epoch
We start by creating an epoch named ‘Welcome,’ which presents some text and prompts the user to press the spacebar to continue. This ensures the participant is prepared to start the calibration procedure
in the next epoch.
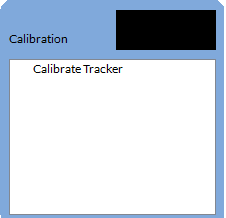
Calibration epoch
The next epoch in our timeline begins when the participant presses the spacebar. First, we insert our Calibrate Tracker command component:
Below is a screenshot of the Properties Window associated with the Calibrate Tracker command component. You can modify these properties to create a customized calibration routine for your experiment.
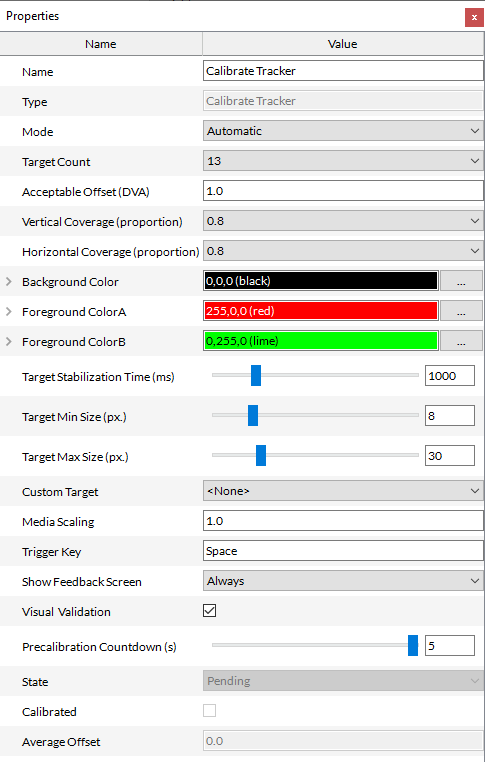
Appendix 1 explains most of the calibration settings shown here; they are also defined in our LabMaestro command documentation.
For now, we will keep most of our defaults and set the following properties:
-
Target Count = 13
-
Acceptable Offset = 1 DVA
-
Show Feedback Screen = Always
-
Precalibration Countdown = 5 seconds
The calibration procedure evaluates if the average error of the collected data exceeds the model prediction by more than the acceptable offset specified by the user. If we set the property Show Feedback Screen to ‘Always,’ the user can view this assessment for each data point on the stimulus display and manually accept or reject the results regardless of the pass/fail status.
Data collection epoch
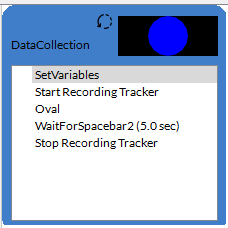
Next, we will add a third epoch to our Timeline. This epoch, ‘DataCollection,’ will manage our experiment trial progression and TRACKPixx3 recording.
On each trial, a blue circle appears and moves smoothly around the screen. Eye movements are recorded until the space bar is pressed or 5 seconds have elapsed. After three trials, the epoch ends.
Several important components must be considered in this epoch. First, we need a method to track trial progression and exit the epoch when our desired number of trials has been reached. We will create a custom variable called trialCount to keep track of our trial count.
Custom variables are created by clicking on the Timeline in the Project Panel, navigating to the Properties Window for the timeline, and clicking on the […] button at the corner of the custom variable field. This will open a widget that allows us to create a custom variable and set it to 0.

Then, we need to update this variable at the beginning of the Data collection epoch. To do so, we use the Set Variables command component and an expression to add +1 to trialCount at the very beginning of the epoch:

Next, we select the Data collection epoch from the Project Panel and set the exit condition to trialCount = 3. This ensures the epoch ends after the third iteration of the epoch.
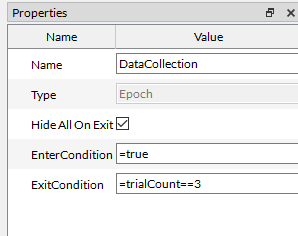
Second, we want to create and animate our stimulus. Our stimulus is a simple blue circle 50 pixels in diameter. After setting the trial count we add an Oval region component to our epoch and modify the colour to Type = Solid, RGB = 0,0,1, and Geometry = 50,50. The Timeline Workspace will automatically update with the new target appearance.
To animate this target, we will define the x and y fields of the Center property as expressions. The expressions leverage the Time variable to continuously update across video frames, creating a smooth stimulus movement.

Time is a special variable that will update regardless of the trial structure. To ensure that the clock effectively resets on each trial and that the target position returns to the same starting position, we create another custom variable in our Timeline, called timeElapsed.
In our Set Variables command at the beginning of the epoch, where we update trialCount, we set timeElapsed = Time. Then, in our expression, we can subtract timeElapsed from Time to reset our clock to 0 at the target onset on that trial.
Next, we add a WaitForInput command component after our stimulus that listens for a press of the space bar. The wait times out after 5 seconds.
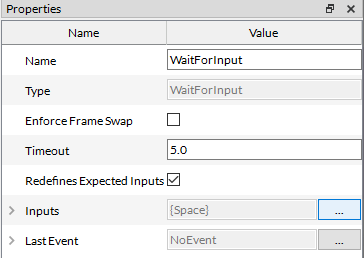
Finally, to record gaze data on each trial, we insert a Start Recording Tracker command component at the beginning of the epoch and a Stop Recording Tracker at the end.
In the Stop Recording Tracker properties panel, we can set the name of the data file created when the recording ends. To easily identify each trial’s data, we set the data file name to =trialCount. This will generate files named 1, 2 and 3 for our three trials.
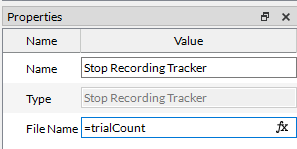
This concludes the preparation of the Data collection epoch.
Adding a drift check
In the next epoch, we implement a drift check. Normally we would not perform a drift check after so few trials, but this is for demonstration.
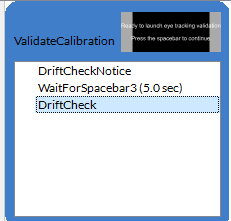
We begin with a simple text region announcing the start of the drift check and prompting the user to press the spacebar to continue. After that, the drift check begins.
In LabMaestro, drift checks are managed with the ValidateTrackerCalibration command component. The properties for this command are very similar to the CalibrateTracker command component. However, there is no feedback screen. As of release 1.8.1, drift checks pass or fail based on whether their average error exceeds the acceptable offset. They cannot be manually accepted/rejected, and no feedback results are presented.
We will keep most of the ValidateTrackerCalibration properties at their default settings. We will rename it “DriftCheck” for clarity, and we will only use 5 targets. We will set a pre-calibration countdown of 5 seconds and an acceptable offset of 1 DVA.
Triggering a recalibration on a failure of the drift check
If the drift check fails, i.e., the average tracking error exceeds the acceptable offset, we want to trigger a recalibration. To implement this, we use a Conditional Branch in our timeline. Conditional Branches can be added by clicking the + icon in the Timeline and selecting a Conditional Branch from the options listed.
Conditional Branches evaluate a single expression. If the expression is evaluated as true, the Timeline progresses along the main experiment branch (to the right of the Conditional Branch in the Timeline Window). If it is evaluated false the timeline progresses to the conditional epoch (below the Conditional Branch in the Timeline Window).
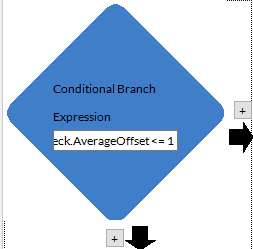
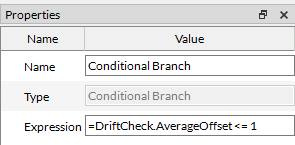
The ValidateTrackerCalibration command component has a property AverageOffset, which is the Euclidean distance from the recorded gaze location and the location of the presented target in degrees of visual angle. This can be accessed within an expression using the syntax commandName.AverageOffset. In our Conditional Branch, we specify that DriftCheck.AverageOffset must be less than or equal to our acceptable offset of 1 degree of visual angle for the Conditional Branch to evaluate as true.
Conditional recalibration epoch
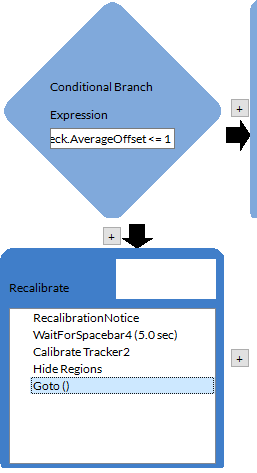
The conditional recalibration epoch follows the same general format as the calibration epoch. It begins with a text region and a prompt for the participant to press the spacebar to continue.
Next, a CalibrateTracker command component runs a new calibration. To keep all the same settings as the original calibration, we simply right-click on the CalibrateTracker component in our Calibration epoch, copy the component, and paste it into this new conditional epoch. The pasted command component is automatically named CalibrateTracker2.
Like the initial calibration, pass/fail evaluation is performed based on the acceptable offset set by the experimenter. We keep the feedback screen set to ‘Always' so that calibration results can be manually accepted or rejected.
Once the recalibration is accepted, we need a method to return to the main Timeline. The HideRegions command component clears the text from our display, and the Goto command redirects the experiment progression to the next epoch in the main branch.
Exit epoch
Our final epoch is called ‘Exit.’ A text region thanks the participant and waits for a spacebar press to close. Here is the full experiment timeline:

Struggling to get good eye tracking data? See our guide: Common Eye Tracking Problems and How to Solve Themor contact our support team with screenshots for practical advice.
Video demonstration
Below is a recording of the experiment, with the experimenter and stimulus displays shown side-by-side. Note the order of events:
-
The camera view is shown and adjusted
-
The experiment is launched by the experimenter
-
Calibration, data recording and drift checks are all managed within the experiment
Exporting and exploring collected gaze data
LabMaestro saves recorded gaze data in the Project Panel under Recordings. These are separated by participant ID and session time. Clicking on the session time shows all recordings collected during the session. Here’s an example of the collected data structure:

TRACKPixx3 data consists of an n x 20 matrix where n is the number of samples collected at a rate of 2 kHz. For a description of each column of the buffer, see this page. To export gaze data collected during a project, navigate to File > Export and select your chosen file directory and data format:
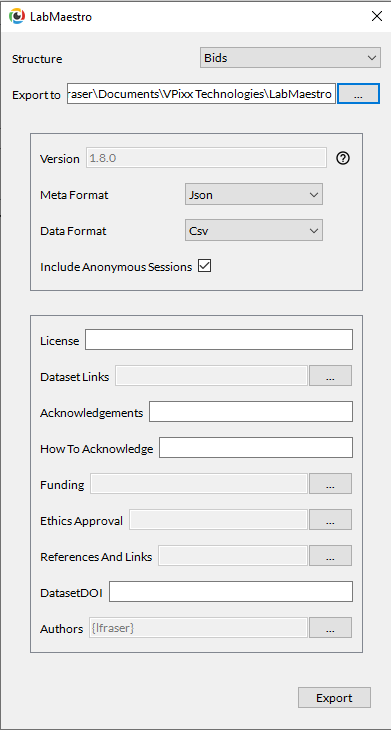
Exporting project data will open a file directory with independent folders for each unique participant ID. Within those folders are subfolders for each experiment session, and these contain individual .csv or .tsv files and .json metadata files for each recording:
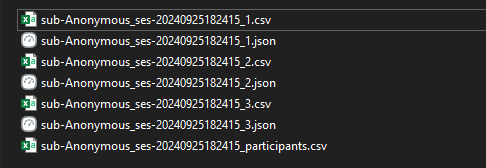
These can easily be imported into your analysis program of choice and contain column headers to help orient you to the file contents.
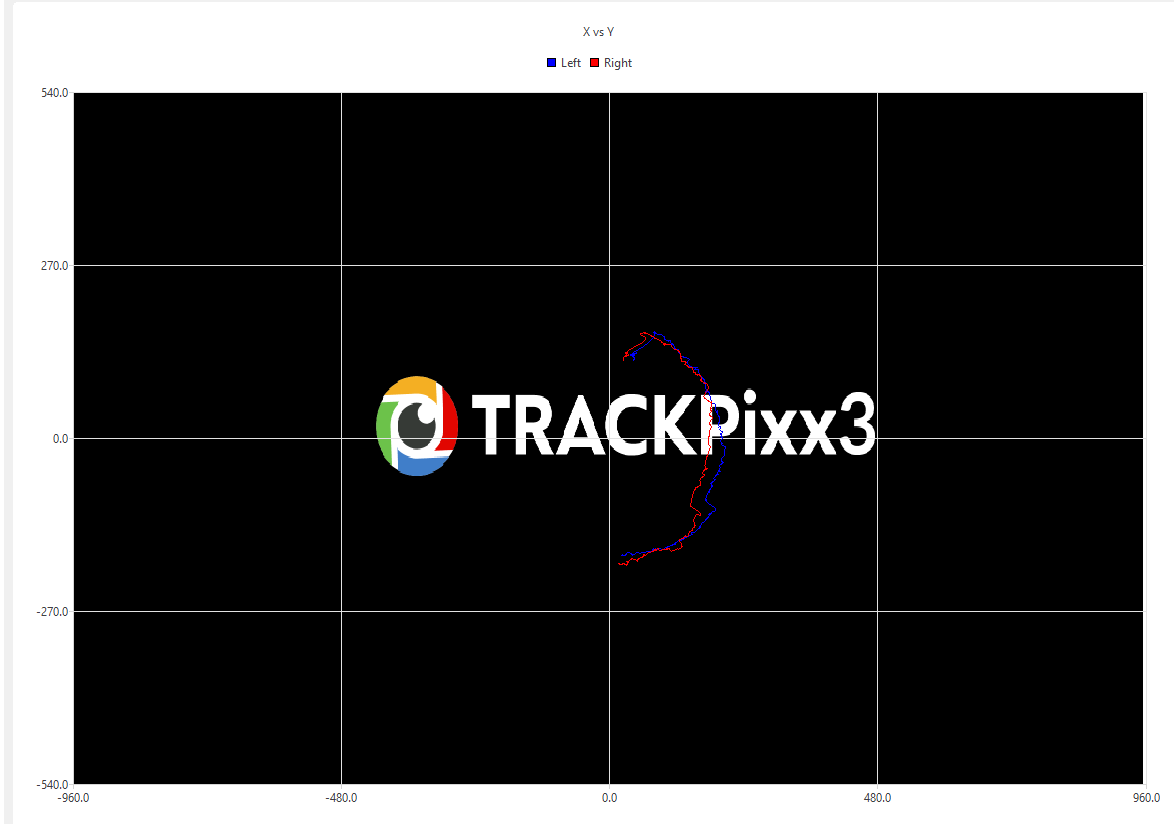
LabMaestro offers basic visualization tools for examining gaze data. For example, double-clicking on a recording in the Project Panel will show a trace of the x and y values of the left and right eyes for the duration of the selected recording. Here’s an example of one such trace from a trial of the experiment we just created:
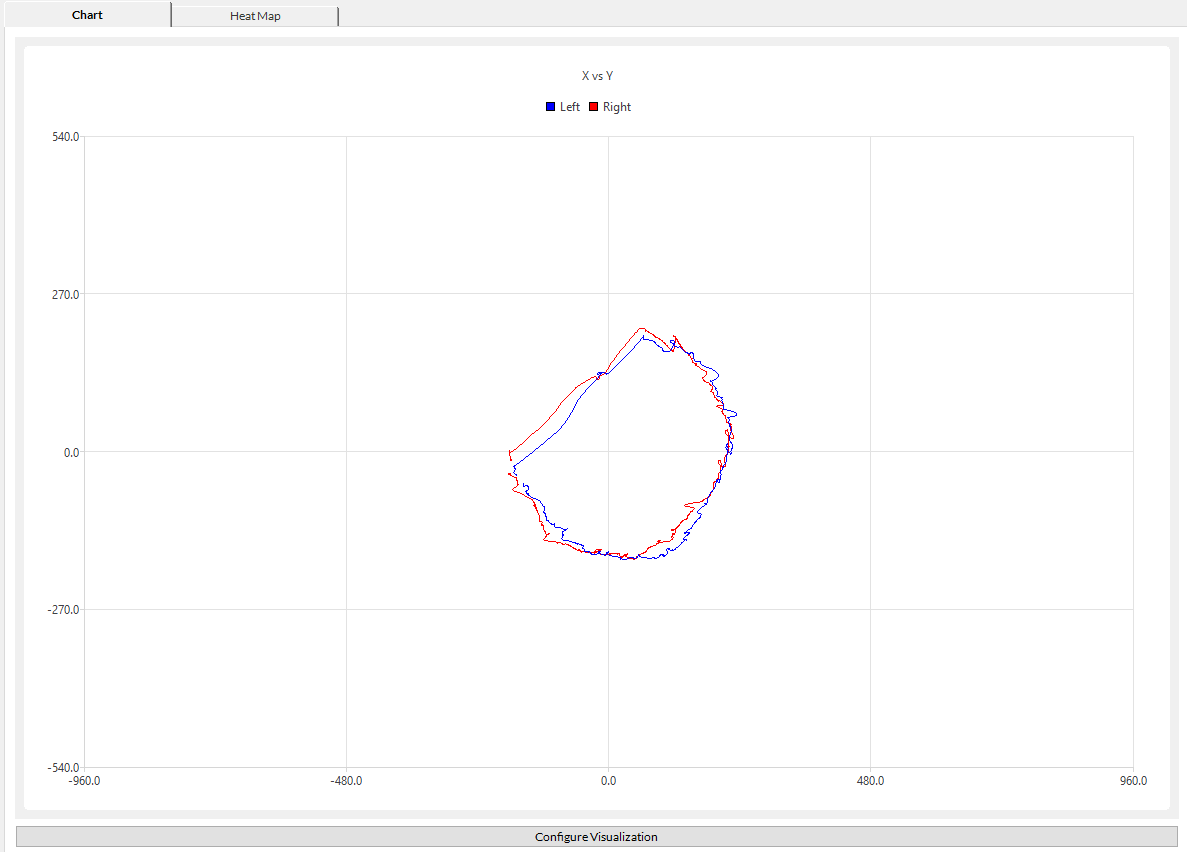
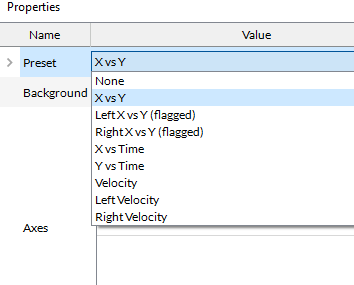
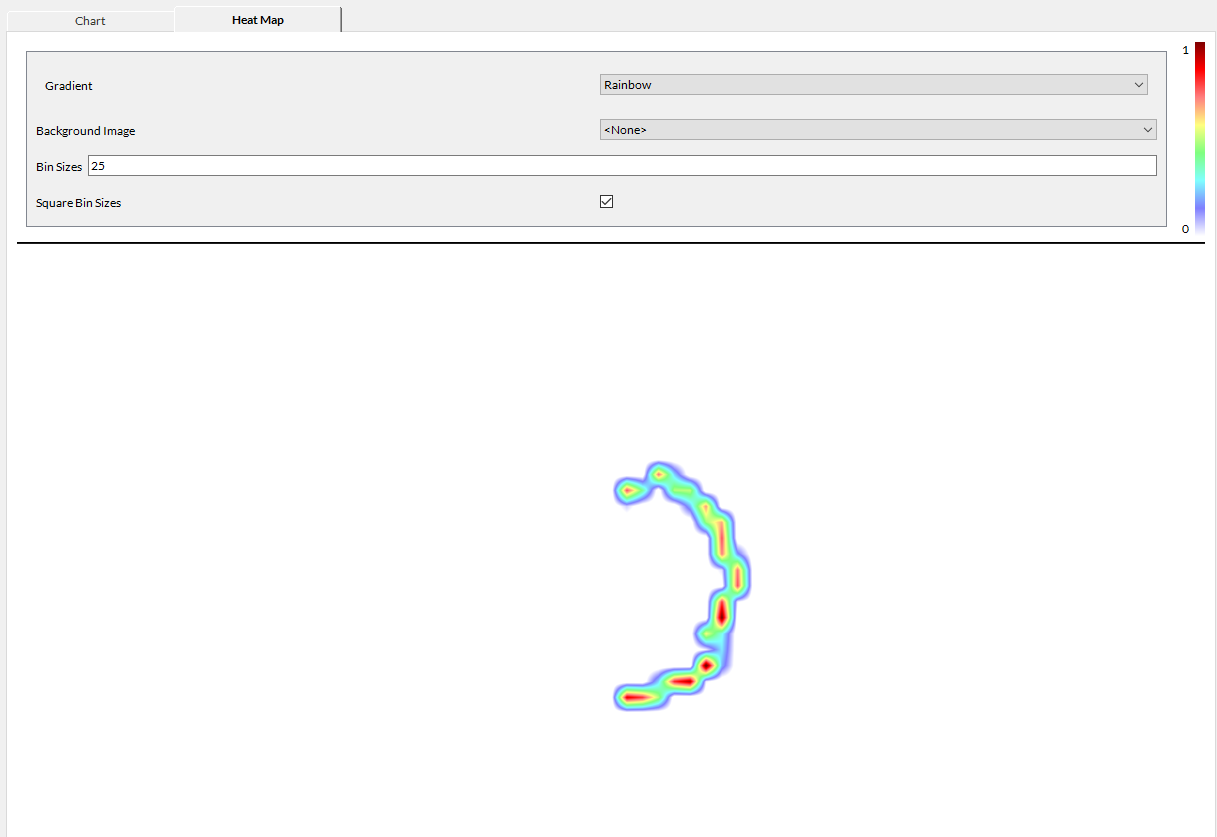
Multiple chart types and configurations are available. A custom background (e.g., a static image presented during the trial) can be added to the trace, and a heatmap of the recording can be viewed.
We encourage you to try this project out, collect some sample data, and explore the data visualization tools.
A variation of the project for short attention spans
Some special populations, like children or non-human primates, may benefit from a calibration routine with fewer and more attention-grabbing targets. In these cases we may also wish to monitor the participant and only trigger data collection when we are confident their attention is captured by the target. Finally, we may also want to relax our acceptable offset criteria to account for noisier data.
The following modified project demonstrates adjusting the calibration and drift check routines for more dynamic calibration. Specifically:
-
Only 5 targets are used
-
Target presentation is scaled to the center 50% of the display
-
The target is an animated gif of a woman smiling and waving
-
Recording gaze during calibration is set to “triggered” rather than automatic. The experimenter or facilitator manually presses the spacebar to collect data for each target.
-
The acceptable offset is set to 2 dva
-
The drift check only uses 3 targets
-
Note: due to a bug in the current release, triggered calibrations must be evaluated in the conditional branch in pixels per dva. This will be fixed in a future release.
All other aspects of the experiment are the same. See below for a video. Note that in this recording, the drift check passed, and thus, the conditional branch was skipped.
The project file for this modification can be found here: [download]. Those wishing to modify this for an NHP subject will need to adjust their TRACKPixx3 device settings to use the species optimization for non-human primates.