Skip table of contents

Implementing a Real-Time Gaze Follower on the Console

This tutorial demonstrates how to implement a real-time gaze follower for the TRACKPixx3 on the console display. This feature is available with M16 and RB3D video modes. Both of these modes have been described, with code examples, in other VOCAL tutorials:

M16 mode is a high bit depth mode that shows up to 12 bits per colour depending on the display. If you are using M16 with a DATAPixx3, TRACKPixx3 and a third-party monitor, the output will be 8 bits per colour. RB3D mode can only be used with a PROPixx.

The Console

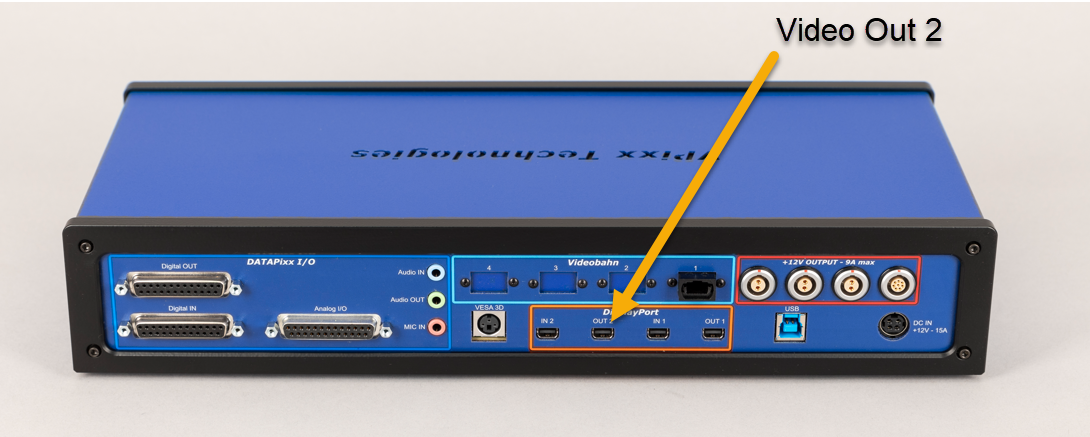
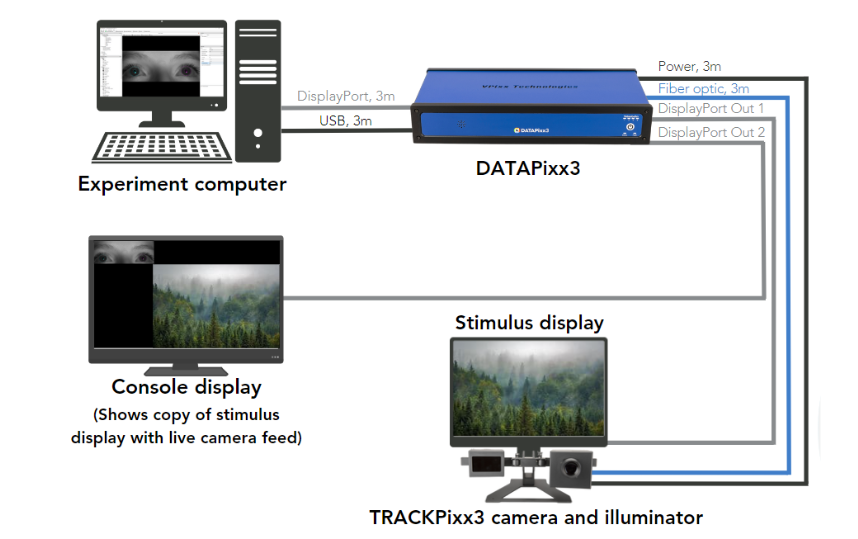
The console monitor is an optional secondary display connected to video out 2 on the DATAPixx3, which acts as a control unit for the TRACKPixx3.

2024-06-27_15-00-05.png

Back of the DATAPixx3 with video out 2 port identified

The console display shows a copy of the stimulus display. If a TRACKPixx3 is connected, the console can also show a live feed of the TRACKPixx3 camera view in the top left corner.

The console allows the experimenter to monitor study progress, without adding any load to the PC graphics card, which could affect the stability of the stimulus display video. However, because the console is a duplicate video signal, it is impossible to present unique information on it.

2024-06-20_10-36-02.png

Example TRACKPixx3 layout with Console Display shown

M16 and RB3D modes allow the user to draw content to both displays such that the content is only visible on the console. They do this by using colour lookup tables (CLUTs) and transparencies.

Colour lookup tables (CLUTs) and transparencies

A CLUT is a 256 x 3 table of R, G and B values. This table is specified by the user and loaded onto VPixx hardware. When a CLUT row is invoked as the colour value for a given stimulus, the stimulus is drawn in the RGB value stored in that row.

The user can create two different CLUTs for the stimulus display and console. If we draw a square on our display and assign its colour as CLUT row 2, the stimulus display will show the square in the colour in row 2 of the stimulus display CLUT, and the console will show the square in the colour stored in row 2 of the console CLUT.

We can also designate a specific RGB colour value as a transparency. If a CLUT row contains this designated value, any content we draw that invokes that row of the CLUT will be transparent.

Using this method, we can create a stimulus display full of transparencies, and a console CLUT full of colours, and invoke the CLUT whenever we want to draw something exclusively on our console (i.e., our real-time gaze data).

Real-time gaze follower in M16 mode. See demo below for how to implement this example.

Adding gaze data

We can use the console to visualize the participant’s gaze in real time. To do this, we will need to routinely poll the participant's current eye position using GetEyePosition.

MATLAB
Datapixx('RegWrRd'); %get most recent data from hardware
[xR, yR, xL, yL, ~,~,~,~,~] = Datapixx('GetEyePosition');

We can use this position to visualize gaze location on the screen.

GetEyePosition is convenient, but slow. Polling the tracker from your PC takes time. We only recommend using GetEyePosition for real-time visualization and online gaze monitoring. For post-processing and analysis of eye movements, use the eye tracking buffer data recorded and stored on our hardware.

Coordinate systems for drawing

Depending on the software you are using, you may need to convert the x, y position information provided by GetEyePosition into the coordinates your software uses for drawing. Consider the conversions below:

Program

Location of Origin (0,0)

(x, y) value of bottom right corner

Conversion

VPixx Screen Coordinates (used by TRACKPixx3)

Center

960, -540

None

Psychtoolbox

Top left corner

1920, 1080

PTBx = x+960; PTBy = 540-y

PsychoPy

Center

1, -1

Use pixel units for drawing gaze trace

These conversions are used in our demonstrations below.

Examples

Gaze overlay in M16 mode

In this example, we present a simple 9-dot grid and show the left and right gaze in cyan and magenta, exclusively on the console.

Psychtoolbox has a useful overlay window feature, which we will use in conjunction with their utilities for drawing in M16 mode.

MATLAB example
MATLAB
%Some PTB setup handling
AssertOpenGL;
KbName('UnifyKeyNames');
Screen('Preference', 'TextAntiAliasing', 0);
Screen('Preference', 'SkipSyncTests', 1);

% Configure PsychToolbox imaging pipeline to use 32-bit floating point numbers
% and M16 output with overlay window.
PsychImaging('PrepareConfiguration');
PsychImaging('AddTask', 'General', 'FloatingPoint32Bit');
PsychImaging('AddTask', 'General', 'EnableDataPixxM16OutputWithOverlay');

%Set up VPixx system & commence eye tracking
Datapixx('Open');
Datapixx('SetTPxAwake');
Datapixx('SetupTPxSchedule');
Datapixx('StartTPxSchedule');
Datapixx('RegWr');

% Open our window and overlay window
screenNumber=max(Screen('Screens'));
[win, winRect] = PsychImaging('OpenWindow', screenNumber, [0,0,0]);
overlay = PsychImaging('GetOverlayWindow', win);

% Ensure that the graphics board's gamma table does not transform our pixels
% Colour corrections can have disastrous effects on CLUTs
Screen('LoadNormalizedGammaTable', win, linspace(0, 1, 256)' * [1, 1, 1]); 

%% CREATE OUR CLUTS
% We'll arbitrarily use full green as our transparency colour
transparencyColor = [0, 1, 0];
Datapixx('SetVideoClutTransparencyColor', transparencyColor);
Datapixx('EnableVideoClutTransparencyColorMode');
Datapixx('RegWr');

% Populate our CLUTs with transparency to start
clutTestDisplay = repmat(transparencyColor, [256,1]);   
clutConsoleDisplay = repmat(transparencyColor, [256,1]);  

% ! ON WINDOWS, DrawFormattedText scales the color by 255/256, therefore
% the color is off by 1 for the upper half of the CLUT 
% On OS-X, DrawFormattedText seems to apply a grossly non-linear mapping
% between the argument intensity and the actual draw intensity.
% Other draw commands like DrawRect do not seem to show this bug.

%Since we only need two colours, we will assign a block of rows to each and pick
%a row in the middle to index. This should avoid any OS-related issues.

%Keep in mind that right and left eye refer to the right and left eyes as they 
%appear in the tracker window. They are not necessarily the left and right eyes 
%from the participant's perspective.
clutConsoleDisplay(1:10,:) = repmat([0, 1, 1], [10,1]);   % Left eye Cyan
clutConsoleDisplay(11:20,:) = repmat([1, 0, 1], [10,1]);   % Right eye Magenta

Datapixx('SetVideoClut', [clutTestDisplay;clutConsoleDisplay]);
Datapixx('RegWr');

%STIMULUS PARAMETERS
% Set some parameters for our 3x3 grid of dots
[centerX, centerY] = RectCenter(winRect);
numDots = 9;
gridSize = 3; % 3x3 grid
dotSpacing = 100; % Spacing between dots in pixels
dotSize = 20; % Diameter of each dot

% Calculate the starting position (top-left corner of the grid)
startX = centerX - (dotSpacing * (gridSize - 1)) / 2;
startY = centerY - (dotSpacing * (gridSize - 1)) / 2;

% Initialize the positions array
positions = zeros(2, numDots);

% Fill the positions array with the coordinates of the 9 dots
index = 1;
for row = 0:(gridSize - 1)
    for col = 0:(gridSize - 1)
        positions(1, index) = startX + col * dotSpacing;
        positions(2, index) = startY + row * dotSpacing;
        index = index + 1;
    end
end

%Specify the radius of our gaze follower markers
gazeRadius = 10;

%Start a while loop that exists on pressing "Escape"
while 1
    % Draw the dots
    Screen('DrawDots', win, positions, dotSize, [1,1,1], [], 2);

    %The overlay plane is not automatically cleared
    %to background (or transparent) color after a flip. Instead its content
    %persists across flips. You need to clear it out manually via a
    %Screen(%FillRect’) command.
    Screen('FillRect', overlay, 255, winRect); %Transparency color
  
    %Get eye position
    Datapixx('RegWrRd');
    [xR, yR, xL, yL, ~,~,~,~,~] = Datapixx('GetEyePosition');

    %Convert camera coordinates (top left is -960, 540) to 
    %screen position in PTB coordinates (top left is 0,0)
    eyePos = [xL+960, 540-yL, xR+960, 540-yR];

    %Draw left and right eyes on overlay
    Screen('FillOval', overlay, 5, [eyePos(1) - gazeRadius, eyePos(2) - gazeRadius, eyePos(1) + gazeRadius, eyePos(2) + gazeRadius]);
    Screen('FillOval', overlay, 15, [eyePos(3) - gazeRadius, eyePos(4) - gazeRadius, eyePos(3) + gazeRadius, eyePos(4) + gazeRadius]);

    %Flip
    Screen('Flip', win);

    %Check for escape
    [~, ~, keyCode] = KbCheck; 
    if keyCode(KbName('Escape'))
        break;
    end
end

Datapixx('StopTPxSchedule');
Datapixx('DisableVideoClutTransparencyColorMode');
Datapixx('RegWr');
Screen('CloseAll');
Python example

Coming soon

Gaze overlay and scrolling flag status indicators in M16 mode

This example extends the previous example by adding a pseudo-scope trace with the event flags for the left and right eyes. These flags indicate if the participant is currently making a saccade or a fixation, and are stored in columns 12-15 of the TRACKPixx3 buffer. The parameters for these flags can be modified by the user with the following commands:

MATLAB
Datapixx('SetFixationThresholds', maxSpeed, numOfConsecutiveSamples );
Datapixx('SetSaccadeThresholds', minSpeed, numOfConsecutiveSamples);
Datapixx('RegWr');

These are simple rolling window averages. For more complex analyses, you must manually apply your algorithm to the raw data.

Here is an example of the scrolling statuses:

image-20240719-201356.png

Example of flag statuses in the console view

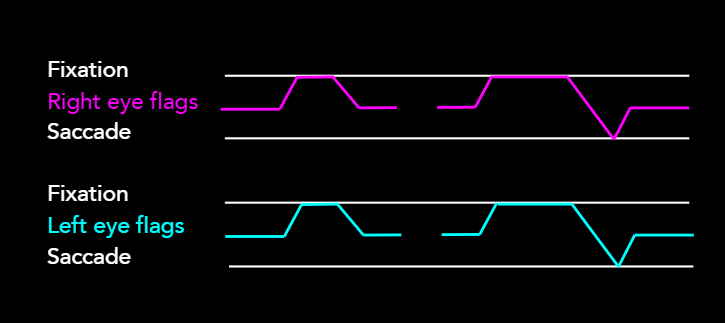
When the trace is high, it indicates the fixation flag is raised for that eye; a low trace indicates a saccade flag is raised. An absence of a trace indicates a blink or tracking loss. An intermediate trace value suggests the eye is tracked, but neither fixation nor saccade criteria have been met.

This demo code could easily be modified to show other trial metadata in the scrolling format, such as:

  • x or y coordinates of either eye

  • when fixation is within a certain region of the display

  • eye movement velocity

  • pupil diameter

Below is a short video showing a demonstration of the scrolling trace:

Video example of the demo

The demo code format is largely the same as the first example. The helper function includeFlagTrace() handles the acquisition and drawing of flag data. It is invoked on every iteration of the drawing loop. A separate helper function allows for easy changes to the displayed data without modifying the main experiment script.

MATLAB Example
CODE
AssertOpenGL;
KbName('UnifyKeyNames');
Screen('Preference', 'TextAntiAliasing', 0);
Screen('Preference', 'SkipSyncTests', 1);

% Configure PsychToolbox imaging pipeline to use 32-bit floating point numbers
% and M16 output with overlay window.
PsychImaging('PrepareConfiguration');
PsychImaging('AddTask', 'General', 'FloatingPoint32Bit');
PsychImaging('AddTask', 'General', 'EnableDataPixxM16OutputWithOverlay');

%Set up VPixx system & commence eye tracking
Datapixx('Open');
Datapixx('SetTPxAwake');
Datapixx('SetupTPxSchedule');
Datapixx('StartTPxSchedule');
Datapixx('RegWr');

% Open our window and overlay window
screenNumber=max(Screen('Screens'));
[win, winRect] = PsychImaging('OpenWindow', screenNumber, [0,0,0]);
overlay = PsychImaging('GetOverlayWindow', win);

% Ensure that the graphics board's gamma table does not transform our pixels
% Colour corrections can have disastrous effects on CLUTs
Screen('LoadNormalizedGammaTable', win, linspace(0, 1, 256)' * [1, 1, 1]); 

% CREATE OUR CLUTS
% We'll arbitrarily use full green as our transparency colour
transparencyColor = [0, 1, 0];
Datapixx('SetVideoClutTransparencyColor', transparencyColor);
Datapixx('EnableVideoClutTransparencyColorMode');
Datapixx('RegWr');

% Populate our CLUTs with transparency to start
clutTestDisplay = repmat(transparencyColor, [256,1]);   
clutConsoleDisplay = repmat(transparencyColor, [256,1]);  

% ! ON WINDOWS, DrawFormattedText scales the color by 255/256, therefore
% the color is off by 1 for the upper half of the CLUT 
% On OS-X, DrawFormattedText seems to apply a grossly non-linear mapping
% between the argument intensity and the actual draw intensity.
% Other draw commands like DrawRect do not seem to show this bug.

%Since we only need two colours, we will assign a block of rows to each and pick
%a row in the middle to index. This should avoid any OS-related issues.

%Keep in mind that right and left eye refer to the right and left eyes as they 
%appear in the tracker window. They are not necessarily the left and right eyes 
%from the participant's perspective.
clutConsoleDisplay(1:10,:) = repmat([0, 1, 1], [10,1]);   % Left eye Cyan
clutConsoleDisplay(11:20,:) = repmat([1, 0, 1], [10,1]);   % Right eye Magenta
clutConsoleDisplay(21:30,:) = repmat([1, 1, 1], [10,1]);   % White for labelling

Datapixx('SetVideoClut', [clutTestDisplay;clutConsoleDisplay]);
Datapixx('RegWr');

%STIMULUS PARAMETERS
% Set some parameters for our 3x3 grid of dots
[centerX, centerY] = RectCenter(winRect);
numDots = 9;
gridSize = 3; % 3x3 grid
dotSpacing = 100; % Spacing between dots in pixels
dotSize = 20; % Diameter of each dot

% Calculate the starting position (top-left corner of the grid)
startX = centerX - (dotSpacing * (gridSize - 1)) / 2;
startY = centerY - (dotSpacing * (gridSize - 1)) / 2;

% Initialize the positions array
positions = zeros(2, numDots);

% Fill the positions array with the coordinates of the 9 dots
index = 1;
for row = 0:(gridSize - 1)
    for col = 0:(gridSize - 1)
        positions(1, index) = startX + col * dotSpacing;
        positions(2, index) = startY + row * dotSpacing;
        index = index + 1;
    end
end

%Specify the radius of our gaze follower markers
gazeRadius = 10;

%Start a while loop that exists on pressing "Escape"
while 1
    % Draw the dots
    Screen('DrawDots', win, positions, dotSize, [1,1,1], [], 2);

    %The overlay plane is not automatically cleared
    %to background (or transparent) color after a flip. Instead its content
    %persists across flips. You need to clear it out manually via a
    %Screen(%FillRect’) command.
    Screen('FillRect', overlay, 255, winRect); %Transparency color
  
    %Get eye position
    Datapixx('RegWrRd');
    [xR, yR, xL, yL, xRawRight,~,xRawLeft,~,~] = Datapixx('GetEyePosition');
    
    %Convert camera coordinates (top left is -960, 540) to 
    %screen position in PTB coordinates (top left is 0,0)
    eyePos = [xL+960, 540-yL, xR+960, 540-yR];

    %Draw left and right eyes on overlay
    Screen('FillOval', overlay, 5, [eyePos(1) - gazeRadius, eyePos(2) - gazeRadius, eyePos(1) + gazeRadius, eyePos(2) + gazeRadius]);
    Screen('FillOval', overlay, 15, [eyePos(3) - gazeRadius, eyePos(4) - gazeRadius, eyePos(3) + gazeRadius, eyePos(4) + gazeRadius]);

    %Draw our "scope" of the flag states
    Screen('TextSize', overlay, 20);
    includeFlagTrace(overlay)
    
    %Flip
    Screen('Flip', win);

    %Check for escape
    [~, ~, keyCode] = KbCheck; 
    if keyCode(KbName('Escape'))
        break;
    end
end

%turn off tracker and disconnect
Datapixx('StopTPxSchedule');
Datapixx('DisableVideoClutTransparencyColorMode');
Datapixx('SetTPxSleep');
Datapixx('RegWr');
Screen('CloseAll');
Datapixx('Close');


%%%%%%%%%%%%%%%%%%%%%%%%%%%%%%%%%%%%%%%%%%%%%%%%%%%%%%%%%%%%%%%%%%%%%%%%%%%

function includeFlagTrace(windowPtr)
%This is a helper function that draws a trace of the rFlag and lFlag for
%eyes in real time on the console. Must be called every frame to get the
%most recent data.

%Arguments:
%windowPtr - PTB window handler

numSamples = 50;
persistent flagArray;
if isempty(flagArray)
    flagArray = nan(numSamples, 2);
end

%Get flags. Assumes RegWrRd has been called recently. If not, uncomment the
%line below
%Datapixx('RegWrRd');
[xR, ~, xL, ~, ~,~,~,~,~] = Datapixx('GetEyePosition');
[leftFixationFlag, rightFixationFlag] = Datapixx('IsSubjectFixating');
[leftSaccadeFlag, rightSaccadeFlag] = Datapixx('IsSubjectMakingSaccade');

%Set our trace values
if xR > 9000 || isnan(xR)
    rFlag = NaN;
elseif rightFixationFlag
    rFlag = -20;
elseif rightSaccadeFlag
    rFlag = 20;
else
    rFlag =0;
end
if xL > 9000 || isnan(xL)
    lFlag = NaN;
elseif leftFixationFlag
    lFlag = -20;
elseif leftSaccadeFlag
    lFlag = 20;
else
    lFlag =0;
end

% Append new measurement to the array
flagArray = [flagArray(2:end, :); [lFlag, rFlag]];

% Get screen size
[screenXpixels, screenYpixels] = Screen('WindowSize', windowPtr);

% Define the drawing area in the top right corner
drawWidth = screenXpixels * 0.25;
drawHeight = screenYpixels * 0.1;
drawXStart = screenXpixels-drawWidth;
drawYStart = 0 + drawHeight/2;
leftOffset = 120; 
textOffset = 150;

% Calculate x positions for the scope trace
xPositions = linspace(drawXStart, drawXStart + drawWidth, numSamples);

%Colours
left = 5;
right = 15;
white = 25;

%Draw legends
Screen('DrawLine', windowPtr, white, xPositions(1), drawYStart-20,xPositions(numSamples), drawYStart-20, 1);
Screen('DrawLine', windowPtr, white, xPositions(1), drawYStart+20,xPositions(numSamples), drawYStart+20, 1);
Screen('DrawLine', windowPtr, white, xPositions(1), drawYStart+leftOffset-20,xPositions(numSamples), drawYStart+leftOffset-20, 1);
Screen('DrawLine', windowPtr, white, xPositions(1), drawYStart+leftOffset+20,xPositions(numSamples), drawYStart+leftOffset+20, 1);

% Draw the left eye flags
for i = 1:length(xPositions)-1
    Screen('DrawLine', windowPtr, left, xPositions(i), drawYStart+leftOffset + (flagArray(i, 1)), xPositions(i+1), drawYStart+leftOffset + (flagArray(i+1, 1)), 2);
end
% Draw the right eye flags trace leftOffset pixels below
for i = 1:length(xPositions)-1
    Screen('DrawLine', windowPtr, right, xPositions(i), drawYStart + (flagArray(i, 2)), xPositions(i+1), drawYStart + (flagArray(i+1, 2)), 2);
end

% Draw labels
DrawFormattedText(windowPtr, 'Left eye flags', drawXStart - textOffset, drawYStart+leftOffset, left);
DrawFormattedText(windowPtr, 'Right eye flags', drawXStart - textOffset, drawYStart, right);
DrawFormattedText(windowPtr, 'Fixation', drawXStart - textOffset, drawYStart+leftOffset-20, white);
DrawFormattedText(windowPtr, 'Saccade', drawXStart - textOffset, drawYStart+leftOffset+20, white);
DrawFormattedText(windowPtr, 'Fixation', drawXStart - textOffset, drawYStart-20, white);
DrawFormattedText(windowPtr, 'Saccade', drawXStart - textOffset, drawYStart+20, white);

%Flip is called in main script

end
Python example

Coming soon

Gaze overlay in RB3D mode

It is possible to track the eyes while the participant wears passive 3D glasses. Consider using search windows to omit glare from the image processing and improve tracking quality. See this guide for more details.

In this example, we present a grid similar to our first example, but in 3D. The left and right eye images are drawn in blue and red, respectively, and are offset slightly from one another.

Psychtoolbox does not have an overlay window feature for this mode, so to draw our gaze follower we will need to index our CLUT using the green colour channel, which is reserved for this purpose. For example, to index row three of the CLUT, we would pass [0,3,0] as the colour value of the stimulus. This stimulus will only appear on the console.

Note that this mode does not require transparencies, as RB3D mode will ignore all CLUT content for the stimulus display. However, we still need to populate a stimulus display CLUT, append the console CLUT to it, and load both onto our hardware to ensure the CLUTs are formatted correctly.

The lack of a dedicated overlay window means that any image or texture with a green component value > 1 will invoke the colour lookup table. This can make images look strange on the console display. To avoid this, do not use green values in your generated stimuli and consider explicitly setting the green channel of any imported stimuli to 0. For example:
image = imread(imagePath); % Load the image
image(:,:,2) = 0; % Set green channel to 0
imageTexture = Screen('MakeTexture', window, image); % Make the image texture

MATLAB example
MATLAB
%% SET UP
%Some parameters
AssertOpenGL;
KbName('UnifyKeyNames');
Screen('Preference', 'TextAntiAliasing', 0);
Screen('Preference', 'SkipSyncTests', 1);

%Set up VPixx system
Datapixx('Open');
Datapixx('SetTPxAwake');
Datapixx('SetupTPxSchedule');
Datapixx('StartTPxSchedule');
Datapixx('RegWr');

%Set our PROPixx up for RB3D with overlay
% Enable PROPixx RB3D Sequencer
Datapixx('Open');
Datapixx('SetPropixxDlpSequenceProgram', 1);
Datapixx('RegWr');

%Enable video mode that supports RB3D with overlay
Datapixx('SetVideoMode', 9);
Datapixx('RegWr');

% You can modify the per eye crosstalk here.
Datapixx('SetPropixx3DCrosstalkLR', 0);
Datapixx('SetPropixx3DCrosstalkRL', 0);
Datapixx('RegWrRd')

% Open our window
screenNumber=max(Screen('Screens'));
[win, winRect] = PsychImaging('OpenWindow', screenNumber, [0,0,0]);

% Ensure that the graphics board's gamma table does not transform our pixels
Screen('LoadNormalizedGammaTable', win, linspace(0, 1, 256)' * [1, 1, 1]); 

%% CREATE OUR CLUTS
clutTestDisplay = repmat([0,0,0], [256,1]);  
clutConsoleDisplay = repmat([0,0,0], [256,1]);  

% ! ON WINDOWS, DrawFormattedText scales the color by 255/256, therefore
% the color is off by 1 for the upper half of the CLUT 
% On OS-X, DrawFormattedText seems to apply a grossly non-linear mapping
% between the argument intensity and the actual draw intensity.
% Other draw commands like DrawRect do not seem to show this bug.

%Since we only need two colours, we will assign a block of rows to each and pick
%a row in the middle to index. This should avoid any OS-related issues.

%Keep in mind that right and left eye refer to the right and left eyes as they 
%appear in the tracker window. They are not necessarily the left and right eyes 
%from the participant's perspective.
clutConsoleDisplay(1:10,:) = repmat([0, 1, 1], [10,1]);   % Left eye Cyan
clutConsoleDisplay(11:20,:) = repmat([1, 0, 1], [10,1]);   % Right eye Magenta

Datapixx('SetVideoClut', [clutTestDisplay;clutConsoleDisplay]);
Datapixx('RegWr');

%% STIMULUS PARAMETERS
% Calculate the positions of the 9 dots in a 3x3 grid
[centerX, centerY] = RectCenter(winRect);
numDots = 9;
gridSize = 3; % 3x3 grid
dotSpacing = 100; % Spacing between dots in pixels
dotSize = 20; % Diameter of each dot

% Calculate the starting position (top-left corner of the grid)
startX = centerX - (dotSpacing * (gridSize - 1)) / 2;
startY = centerY - (dotSpacing * (gridSize - 1)) / 2;

% Initialize the positions array
positions = zeros(2, numDots);

% Fill the positions array with the coordinates of the 9 dots
index = 1;
for row = 0:(gridSize - 1)
    for col = 0:(gridSize - 1)
        positions(1, index) = startX + col * dotSpacing;
        positions(2, index) = startY + row * dotSpacing;
        index = index + 1;
    end
end

%Let's add an offset for our other eye image
positionsRight = positions-5;

%And our gaze follower radius
gazeRadius = 10;

%% PRESENTATION LOOP
%Start a while loop that draws our grid and the gaze position on the
%console. Hitting 'escape' ends the loop.
while 1
    % Draw the dots for our left eye in blue
    Screen('DrawDots', win, positions, dotSize, [0,0,255], [], 2);

    % Draw the dots for our right eye in red
    Screen('DrawDots', win, positionsRight, dotSize, [255,0,0], [], 2);
  
    %Get eye position
    Datapixx('RegWrRd');
    [xR, yR, xL, yL, ~,~,~,~,~] = Datapixx('GetEyePosition');

    %Convert to camera coordinates (top left is -960, 540) to 
    % screen position in PTB coordinates (top left is 0,0)
    eyePos = [xL+960, 540-yL, xR+960, 540-yR];
    disp(eyePos)

    %Draw left and right eyes on console. Console CLUT is indexed via the green
    %colour channel.
    Screen('FillOval', win, [0,5,0], [eyePos(1) - gazeRadius, eyePos(2) - gazeRadius, eyePos(1) + gazeRadius, eyePos(2) + gazeRadius]);
    Screen('FillOval', win, [0,15,0], [eyePos(3) - gazeRadius, eyePos(4) - gazeRadius, eyePos(3) + gazeRadius, eyePos(4) + gazeRadius]);

    %Flip
    Screen('Flip', win);

    %Check for escape
    [~, ~, keyCode] = KbCheck; 
    if keyCode(KbName('Escape'))
        break;
    end
end

%% SHUT DOWN
% Set the PROPixx back to normal sequencer
Datapixx('SetPropixxDlpSequenceProgram', 0);
Datapixx('SetVideoMode', 0);
Datapixx('StopTPxSchedule');
Datapixx('RegWrRd');

% Done. Close the onscreen window.
Screen('CloseAll')
Datapixx('Close');
Python example

Coming soon

JavaScript errors detected

Please note, these errors can depend on your browser setup.

If this problem persists, please contact our support.