This experiment was developed in Spyder IDE 5.4.5 using Python 3.11, and tested in Windows 10. Bugs and feedback can be reported to support@vpixx.com.
This example implements a simple experiment structure with 3 repeated trials in Python code. It demonstrates the following:
-
How to invoke a calibration from within a Python IDE
-
How to trigger TRACKPixx3 recording on a trialwise basis
-
How to send a synchronization trigger indicating the stimulus is onscreen
-
How to save TRACKPixx3 data collected while the trigger is active
-
How to perform a simple drift check
We recommend running this experiment with at least two screens: the stimulus display (connected to the DATAPixx3) and the experimenter display.
Step-by-step explanation
The code progression is as follows:
-
We open a PsychoPy window on the stimulus display. It is important to do this as a first step, as our calibration routine expects to run in an already open window.
-
A TRACKPixx3 calibration is performed. This includes a check for pixel identity passthrough, which is important for sending accurate synchronization trigger values. The calibration starts with a GUI prompt for settings:
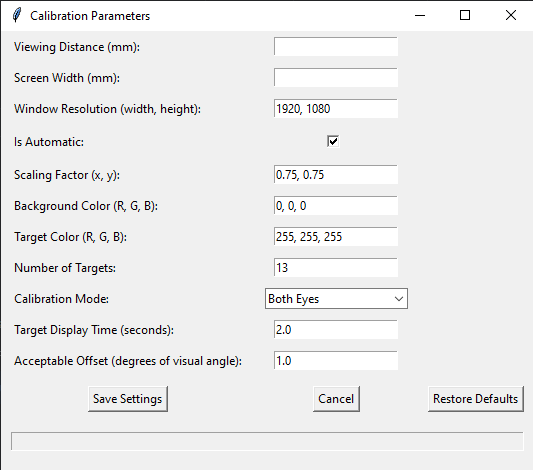
Calibration Parameter GUI in Python Hover over each setting label to view a text description of the setting.
Once settings have been saved, the camera focus and gaze-point calibration will start. For more details, see TRACKPixx3 Calibration Walkthrough. -
Once the calibration is complete, instructions are shown on the stimulus display for 4 seconds.
-
Trial 1 begins:
-
As a first step, we start TRACKPixx3 recording with
startRecording. This returns an initialized dictionary called ‘status,’ which we will populate later once we have collected some data. -
Next, we define a trigger for the trial, called
myTrigger. This will signal to the tracker when the stimulus is onscreen, and help us segment our data. -
Next, we call the function
drawMovingDot(defined at the top of the script). This function is a loop that updates the stimulus position on each frame and draws it. It also calls a command from TPxTools calleddrawSyncTriggerOnNextFlip, which draws a single pixel in the top left corner of the display, with a value set bymyTrigger. This will automatically set the digital out port to the value ofmyTriggeron each frame. To learn more about how this works, see our guide to Sending video frame accurate triggers using Pixel Mode. After the stimulus and sync trigger are drawn, the window is flipped. A keypress exits the stimulus drawing loop. -
At the end of the trial, we stop the TRACKPixx3 recording, and import the recorded data from the DATAPixx3 to our PC, with the single command
data = tp.stopRecording(status). Recall that status is an initialized dictionary returned by our start recording command; this is used to structure the results and ensure all recorded data is imported. Data is an nx20 array of TRACKPixx3 buffer data. -
A helper function
trimTPxDataToTriggerreturns only the data collected while the digital out port was set to our trigger value (i.e. only data collected when the stimulus was onscreen). -
The command
saveTPxDataToCSVsaves our data to a file called Trial-1 in the current folder.
-
-
Trial 2 repeats step 4 for the next stimulus. In a true experiment, you could create a loop for trials to avoid repeating so many lines of code. However, for demonstration purposes, the trials are each spelled out explicitly.
-
Trial 3 repeats step 4, and plots the trimmed data to the Python console via the TPxTools function
plotTPxData. X vs Y positional data is shown for left and right eyes in blue and red, respectively: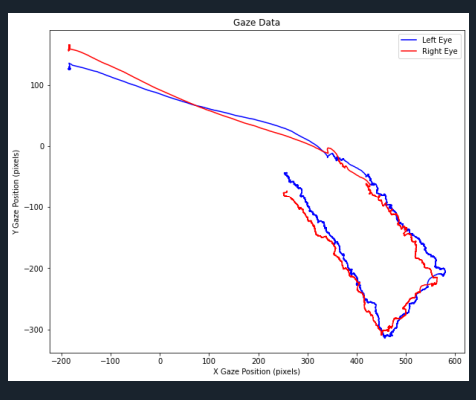
Example result of plotTPxData -
The experiment then calls a drift check with the original calibration handler object (returned by our calibration command in step 1). We ask for the first 5 targets to be tested in the drift check. This will launch the drift check procedure. If a recalibration is required the calib object will update with the new calibration data.
-
The experiment ends. The screen is closed and a tracker shutdown command is called.
Code example
from psychopy import visual, core
from psychopy.hardware import keyboard
import random
import TPxTools as tp

def drawMovingDot(windowPtr, dotColor, triggerValue):
    #This is a little helper function to draw our animated moving dot.
    kb = keyboard.Keyboard()

    # Create our stimulus, a dot
    dot = visual.Circle(windowPtr, radius=20, fillColor=dotColor, lineColor=dotColor)

    # Define the dot boundaries to be 60% of screen
    screen_width, screen_height = windowPtr.size*0.6
    left_boundary = -screen_width // 2 + dot.radius
    right_boundary = screen_width // 2 - dot.radius
    top_boundary = screen_height // 2 - dot.radius
    bottom_boundary = -screen_height // 2 + dot.radius

    # Random starting position for the dot
    x, y = random.uniform(left_boundary, right_boundary), random.uniform(bottom_boundary, top_boundary)
    dot.pos = (x, y)

    # Random initial velocity
    vx, vy = random.uniform(-2, 2), random.uniform(-2, 2)

    # Main loop
    while 1:
        keys = kb.getKeys()

        if not keys:
            # Update the dot's position
            x += vx
            y += vy

            # Bounce off the edges
            if x >= right_boundary or x <= left_boundary:
                vx = -vx
            if y >= top_boundary or y <= bottom_boundary:
                vy = -vy

            # Update the dot's position
            dot.pos = (x, y)

            # Draw our Pixel Mode trigger
            tp.drawSyncTriggerOnNextFlip(windowPtr, triggerValue)

            # Draw the dot
            dot.draw()

            # Flip the window
            windowPtr.flip()

            # Small delay
            core.wait(0.01)

        else:
            break


#MAIN SCRIPT
###############################################################################
# Step 1: Open a windowPtrdow on screen specified by 'screenNumber'
windowPtr = visual.Window(color='black',screen=1, fullscr=True, units='pix')

# Step 2: Call a calibration
calib = tp.initialCalibration(windowPtr)

# Step 3: Present experiment instructions
message = visual.TextStim(windowPtr, text="Follow the dots!", pos=(0, 0), color=(1, 1, 1))
message.draw()
windowPtr.flip()

core.wait(4)

##Step 4: Trial 1----------------------------------------------------------------------
#a) Record data
status = tp.startRecording()

# b) Set a trigger value for the trial
myTrigger = 10

# c)Draw stimulus and loop until keypress
drawMovingDot(windowPtr, 'pink', myTrigger)

# d) Stop recording and import
data = tp.stopRecording(status)

# e) Only save data from when trigger was on, i.e., when dot was onscreen
trimmedData = tp.trimTPxDataToTrigger(data, myTrigger)

# f) Save trimmed data to .csv
tp.saveTPxDataToCSV(trimmedData, 'Trial-1.csv')

##Step 5: Trial 2----------------------------------------------------------------------
#a) Record data
status = tp.startRecording()

# b) Set a trigger value for the trial
myTrigger = 20

# c)Draw stimulus and loop until keypress
drawMovingDot(windowPtr, 'blue', myTrigger)

# d) Stop recording and import
data = tp.stopRecording(status)

# e) Only save data from when trigger was on, i.e., when dot was onscreen
trimmedData = tp.trimTPxDataToTrigger(data, myTrigger)

# f) Save trimmed data to .csv
tp.saveTPxDataToCSV(trimmedData, 'Trial-2.csv')

## Step 6: Trial 3----------------------------------------------------------------------
#a) Record data
status = tp.startRecording()

# b) Set a trigger value for the trial
myTrigger = 30

# c)Draw stimulus and loop until keypress
drawMovingDot(windowPtr, 'green', myTrigger)

# d) Stop recording and import
data = tp.stopRecording(status)

# e) Only save data from when trigger was on, i.e., when dot was onscreen
trimmedData = tp.trimTPxDataToTrigger(data, myTrigger)

# f) Save trimmed data to .csv
tp.saveTPxDataToCSV(trimmedData, 'Trial-3.csv')

#Let's plot our trial 3 data for fun
tp.plotTPxData(trimmedData)

## Step 7: Drift Check of five targets to ensure calibration is still valid.---------
calib = tp.driftCheck(windowPtr, calib, 5)

##Continue experiment here-----------------------------------------------------

## Step 8: Close the window
windowPtr.close()
tp.shutdownTracker()
core.quit()
Video demonstration