Introduction
This project introduces the notion of project-based eye-tracker settings and customized calibration procedures.
Prerequisites
-
LabMaestro is installed and activated.
-
You have a VPixx eye-tracking device (e.g., TRACKPixx3, TRACKPixx mini) connected to your computer via an I/O hub or a DATAPixx3.
Project Files
-
LabMaestro 1.6.0: TPxCalibration_TPx3_V1.lm
-
LabMaestro 1.7.0 and above: TPxCalibration_TPx3_1_7_0_V1.lm
This template project was developed for the features available in LabMaestro 1.7.0 and assumes that the operator controls progression with a keyboard. This documentation also assumes that the TRACKPixx3 has been installed according to the relevant TRACKPixx3 installation guide, that users are familiar with the Principles of TRACKPixx3 operation, and that they have set up their TRACKPixx3 via the Setup TRACKPixx3 interface.
Prerequisites
-
LabMaestro is installed and activated.
-
You have set up your TRACKPixx3 eye tracker through your DATAPixx device.
Calibrating the TRACKPixx3
Add the Hardware to Your Project
First, download the latest template project for your LabMaestro version and open it from LabMaestro. Navigate to the Environment from the Project Panel and confirm that the DATAPixx3 and TRACKPixx3 are detected and added to the project. Refer to Adding VPixx Hardware to a project for more information.
Adjust Required Project Device Settings
To ensure your hardware is properly configured for the experiment, click the DATAPixx3 to open the DATAPixx device settings. Click on Apply All to push the project’s required device values to the connected device, replacing the Current Values. Mismatches between required and current project values are identified in red. You can apply the same process to the TRACKPixx3 device settings.
Once this is done, associate the active display connected to the DATAPixx3 and ensure it is the Main Display.
Your main display should be the one set up with the TRACKPixx3 device.
Then, measure and adjust the viewing distance, in centimetres (refer to Displays for more information), and save the project before continuing. The viewing distance will automatically be taken into account to adjust some stimulus sizes and generate the online fixation and saccade flags.
Understanding the Template Project Structure
The Experiment Design is structured in two phases, implemented as two consecutive Timelines. First, the TRACKPixx3Calibration timeline runs a customized calibration sequence and provides feedback on the calibration's overall accuracy. Then, the RecordTrackerSample timeline displays real-time feedback on the calibration's overall accuracy and concurrently records eye-tracking data for subsequent inspection.
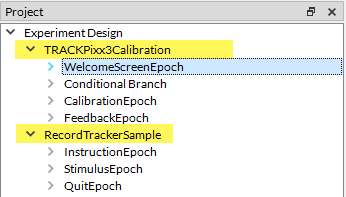
TRACKPixx3Calibration Timeline
When you click a timeline in the project panel, a timeline tab opens, displaying the Epochs and a preview of the screen's visual content.
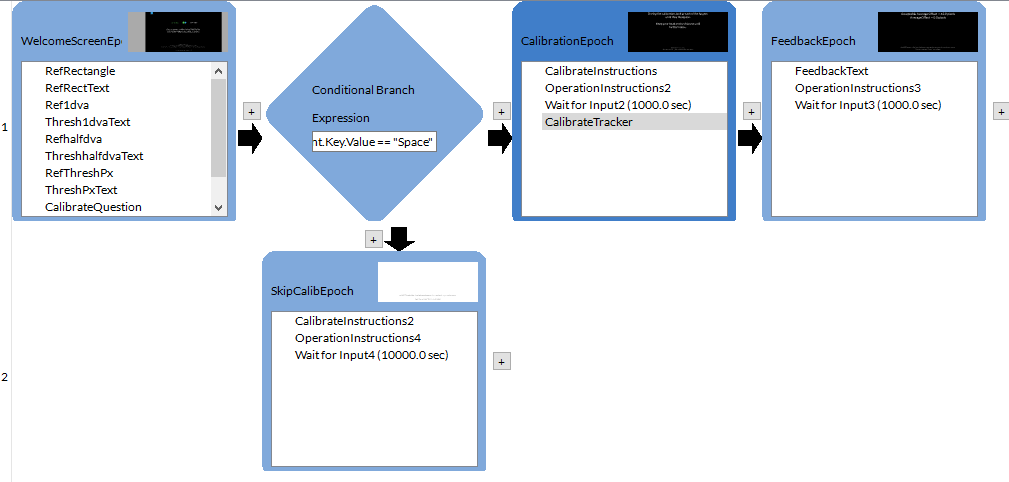
The WelcomeScreenEpoch constructs a summary of useful information for the timeline.
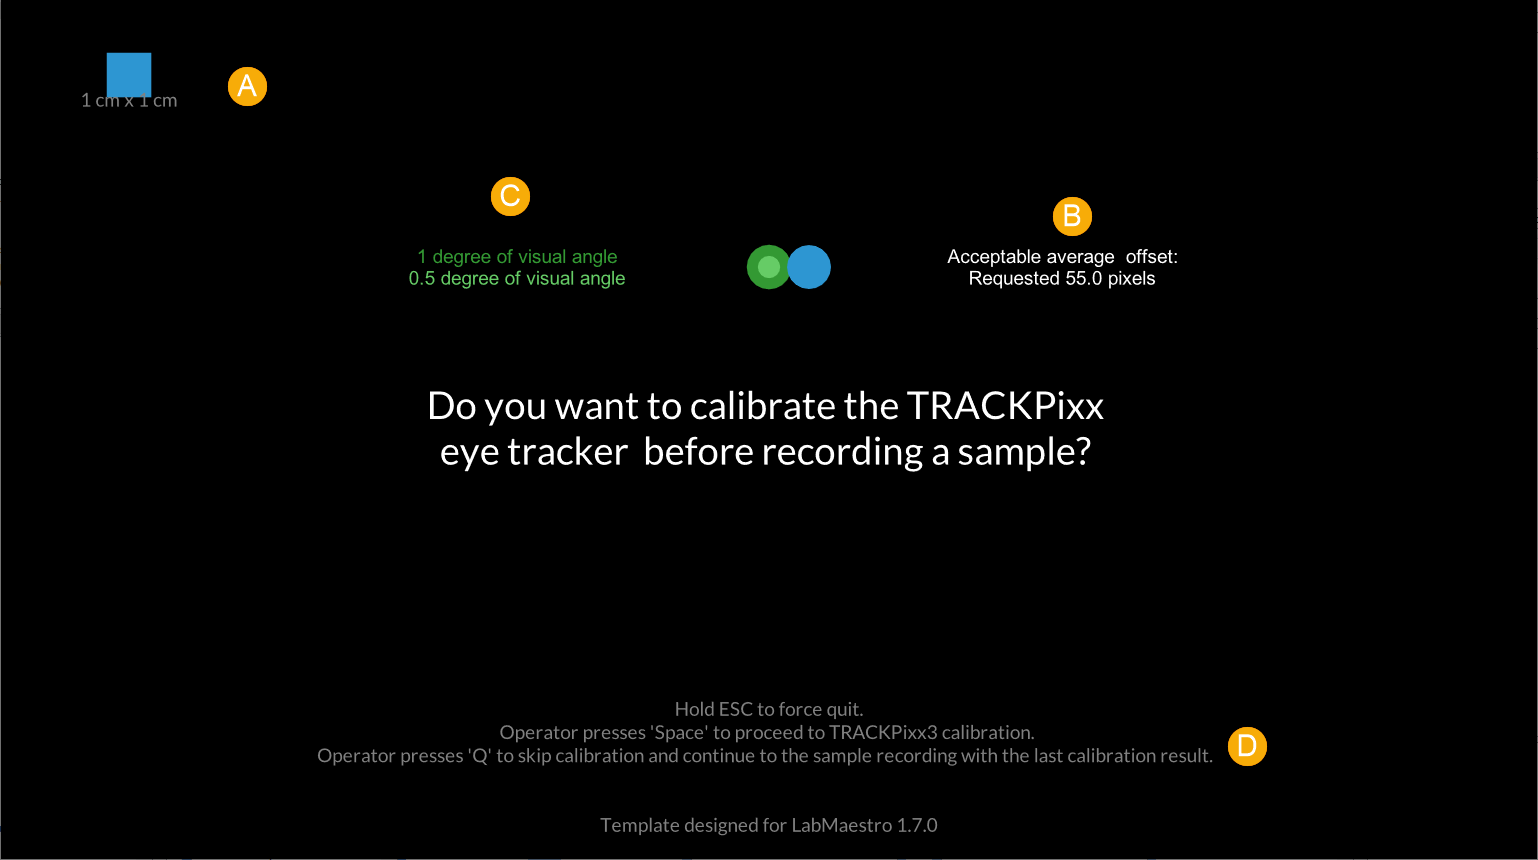
a. RefRectangle: A 1 cm x 1 xm Rectangle drawn to scale using the Displays characteristics.
b. Acceptable threshold: An Oval that provides visual feedback about the acceptable threshold currently defined in the Calibrate Tracker command. In LabMaestro Public Beta 1.6.0 through LabMaestro 1.7, this value is specified in screen-space pixels, and the default value may need to be adjusted based on the viewing distance, layout, and accuracy criterion. In this version, the default acceptable threshold is 55 pixels, which corresponds to 1 degree of viewing angle at 57.3 cm.
c.Ref1dva and Refhalfdva: Ovals with a diameter measuring 1 and 0.5 degrees of visual angle, drawn to scale using the Displays. You can toggle the value type between degrees and pixels from the property panel. Use this information to adjust the acceptable threshold in the Calibration Command as desired.
d. Operator information: Summarizes the keyboard keys that will be functional in this template project, and their effect. Remember that you can press Esc at any time during a Play Timeline or Launch Experiment to force quit.
Progression in the timeline is paused until either the Space or Q keys are pressed.
After LabMaestro detects a valid input, the Conditional Branch evaluates whether the ‘Space’ key was pressed; if so, the timeline proceeds to CalibrationEpoch; otherwise, it proceeds to SkipCalibEpoch.
In CalibrationEpoch, the project-specific calibration for the TRACKPixx3 is implemented via the Calibrate Tracker command. Timeline progression pauses until calibration completes. If calibration is successful, the experiment view will proceed to the FeedbackEpoch, where the acceptable average offset will be reported, along with the calculated average offset for the eyes selected on the Setup TRACKPixx3 page.
RecordTrackerSample Timeline
When opening the RecordTrackerSample timeline, a short example of how to use an eye-tracking recording schedule will be displayed. This implementation is representative of expected implementations in experiments driven by Methods. In the context of this project, this timeline generates a single eye-tracking recording that you can examine with LabMaestro’s Recordings and Built-In Data Visualization. You can also use Data Export to obtain data files which can be manipulated and analyzed in other software.
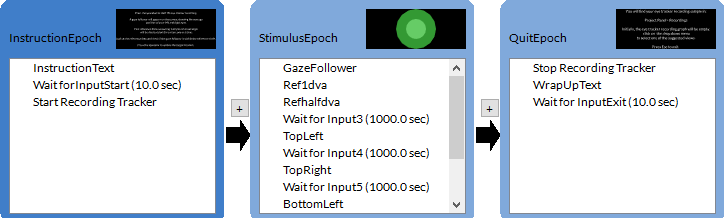
The timeline is divided into three Epochs:
-
The InstructionEpoch contains the instructions shown to the user and will initiate an eye-tracking recording schedule immediately after a spacebar input.
-
The StimulusEpoch will display a gaze follower showing the average positions of the left and right eyes. Five reference dots, each measuring one degree of visual angle, will be displayed one at a time. The location of the reference dot will be updated every time the user presses the spacebar, using the Set Variables command. The (x, y) coordinates of the dot centers, in pixels, have been set to (0, 0), (-350, 350), (350, 350), (-350, -350), and (350, -350).
-
Finally, QuitEpoch stops the recording schedule and displays a message reminding users that the recording will be available in the project panel after the experiment concludes.
To evaluate the recording quality, we recommend that users adjust the stimulus details to match the task requirements. For example, some may prefer to: display static Regions and instruct participants to specific locations; include a Picture Pattern representative of the experiment stimuli; or use Expressions to implement a simple gaze-control routine.
Launching the Experiment and Reviewing the Session Data
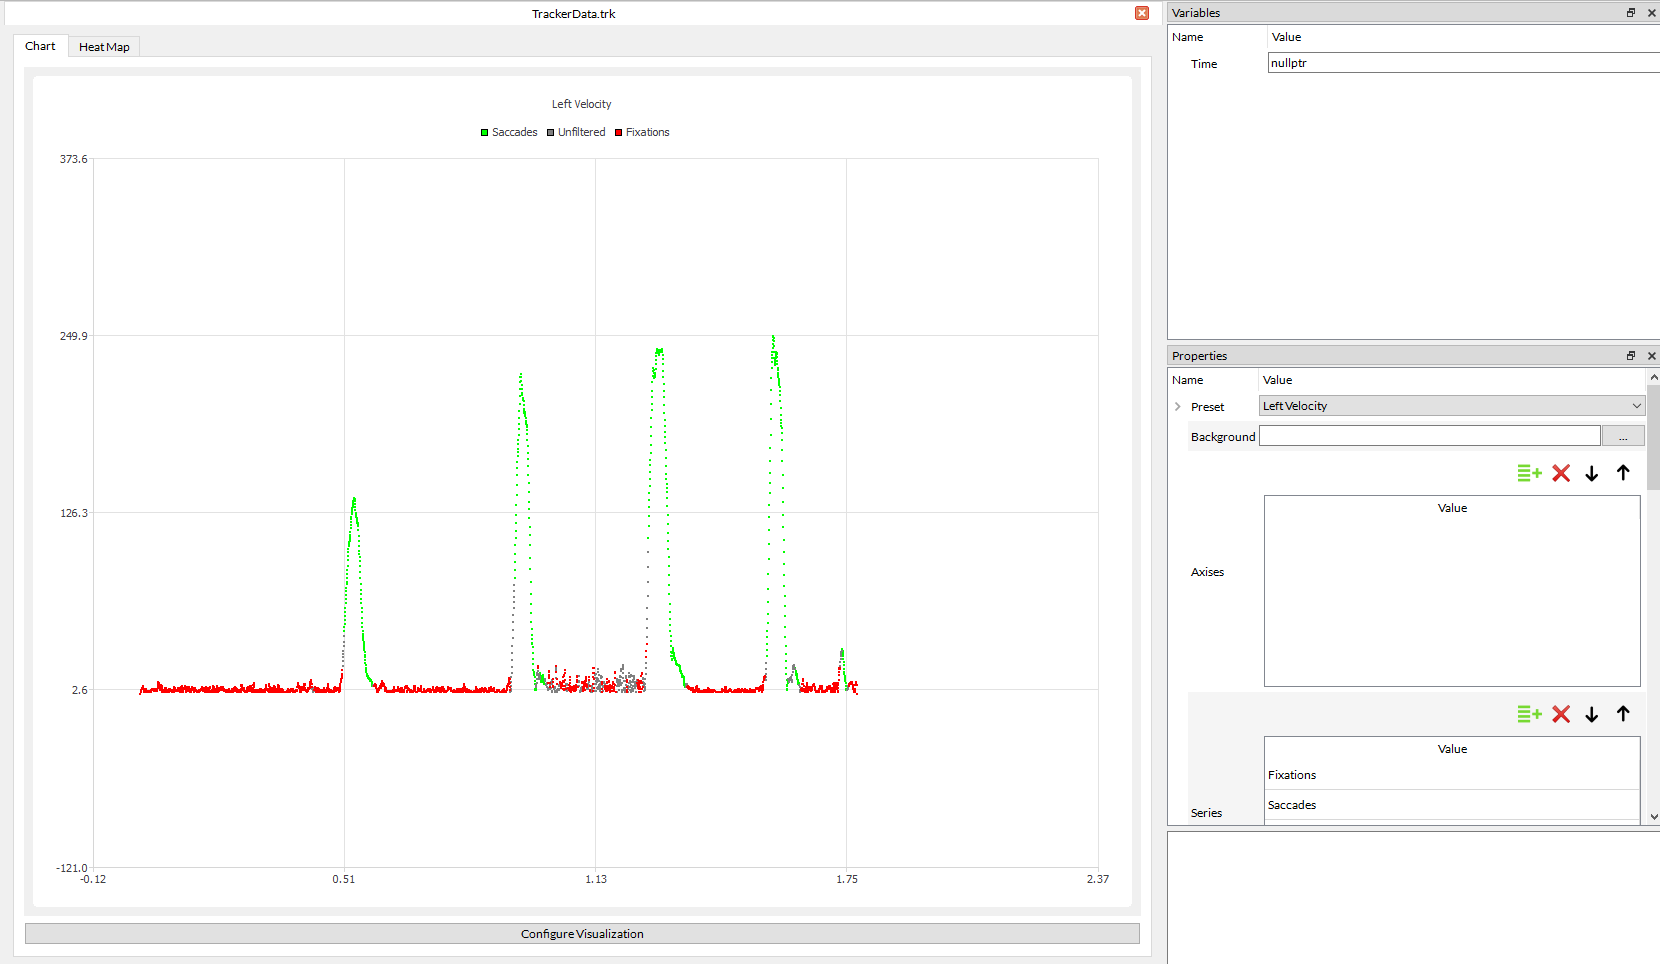
After having followed the previous steps, press Launch Experiment to see the project in action. After the experiment session has concluded, you can use the Recordings and Built-In Data Visualization to see a summary of the data. Navigate to the session’s *.trk recording file. By default, the software displays raw gaze data from each eye; inspect whether the left- and right-eye traces are sufficiently close to the reference dot centers for the task requirements.
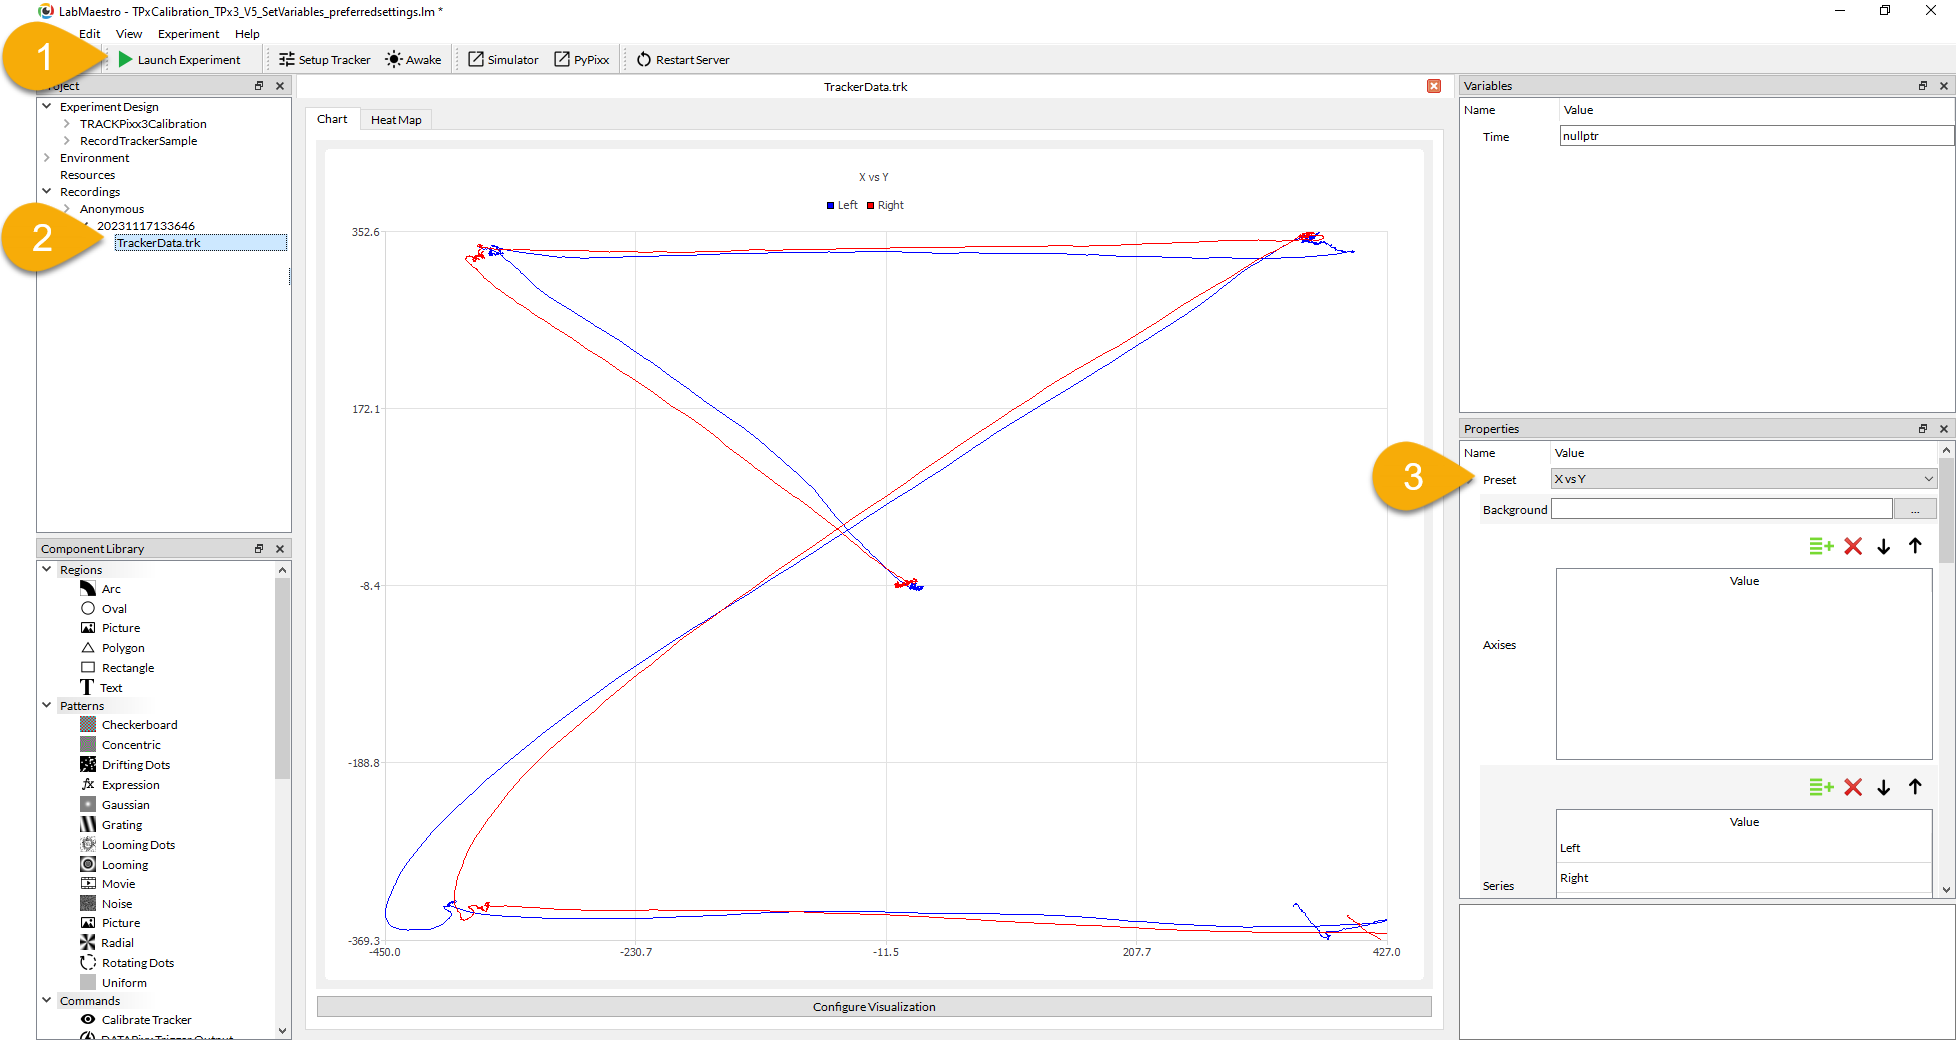
As a reminder, these locations are (0,0), (-350, 350), (350, 350), (-350, -350), and (350, -350).
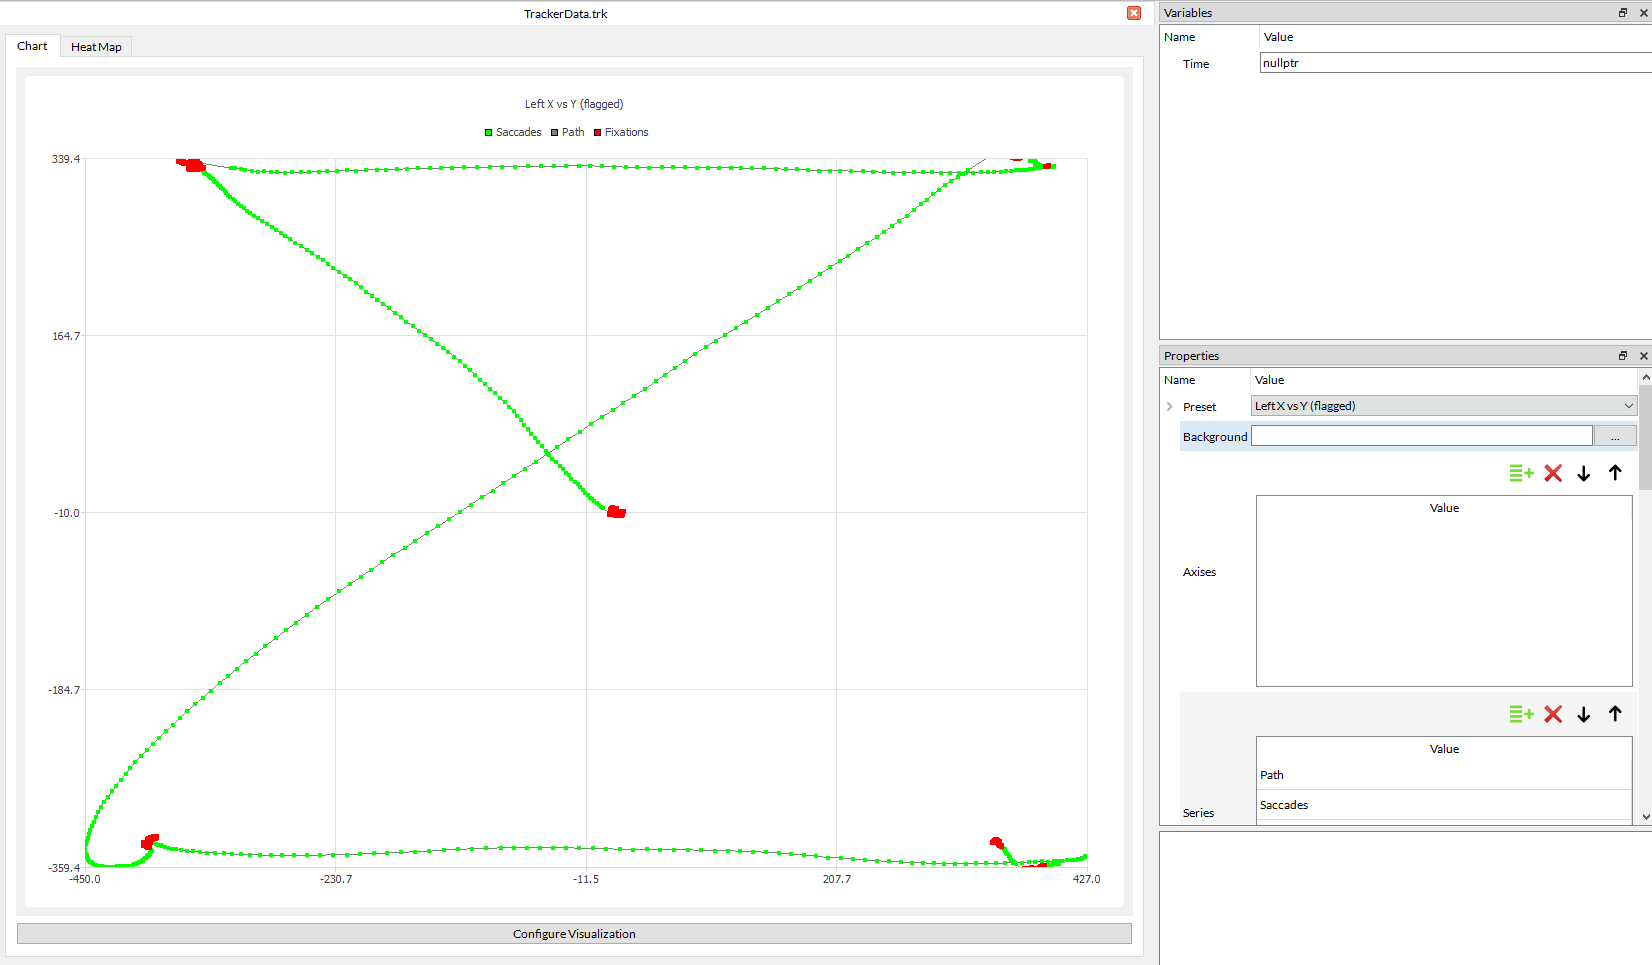
The following data visualization presets present complementary, detailed gaze information:
-
Left X vs Y (flagged) and Right X vs Y (flagged): Show gaze location, colour-coded for online-generated fixations and saccades. These views allow rapid evaluation of the suitability of online-flagged fixation and saccade thresholds.
-
Left Velocity and Right Velocity: Show the left or right eye velocity in degrees of visual angle over time, colour-coded for online-generated fixations and saccades. These views facilitate the choice of new fixation and saccade thresholds, if desired.