Research-grade displays must have precisely characterized temporal properties and high inter-frame independence. The latter is especially important for displaying rapidly changing or dynamic stimuli and is critical for presenting frame-sequential dichoptic stimuli.
This requirement poses a particular challenge for modern liquid crystal displays (LCDs). As noted by several researchers (e.g., Elze & Tanner, 2012; Ghodrati, Morris & Price, 2015), commercial LCDs have distinct characteristics that make them less than desirable for precisely timed research. Specifically:
-
The output of each R, G, and B subcomponent of a pixel on an LCD panel is a property of the liquid crystal's molecular structure.
-
Changing this molecular structure takes time. The pixel response time, or the time for the liquid crystal structure to transition between states, can vary across pixel values.
-
LCD panels update row-by-row from top to bottom, meaning vertically offset pixels also differ in their temporal illumination profiles.
-
LCD panels typically use a ‘display and hold’ method. Once a pixel stabilizes, it remains illuminated until a new voltage is applied, at which point the next transition begins.
-
Commercial LCDs use a constant backlight, so the viewer can see this transition, vertical offset, and display and hold behaviour.
Unfortunately, these characteristics can increase display ghosting and motion blur and, in the case of alternating-frame dichoptic stimuli, add cross-talk between left and right eye images; cross-talk is the imperfect separation of the two eye’s images during dichoptic presentation.
More practically, the gradual pixel illumination ramp of a commercial LCD requires researchers to arbitrarily define visual stimulus ‘onset’ time, thus adding variability and subjectivity to experiment reporting. This can, in turn, affect the precision of other measurements, e.g., from neurophysiological recordings.
For more precise temporal behaviour, many researchers prefer the Cathode-Ray Tube (CRT) monitors. In these, the image scans down the display, and “pixels” extinguish shortly after their illumination, thus showing more consistent timing and crisp, independent transitions between individual video frames. However, CRT technology is rapidly becoming obsolete and has other disadvantages (e.g., limited refresh rates and screen size, limited availability).
In this VOCAL, we show how our VIEWPixx /3D and /EEG research-grade displays use an innovative scanning backlight to mimic the rapid pixel illumination/extinction pattern of a CRT display on an LCD monitor, thus offering researchers the advantages of a CRT’s precise temporal characteristics on a modern high-resolution display. We also demonstrate how researchers can take analog photodiode measurements using the VIEWPixx/3D’s data acquisition system and estimate the sub-frame timing of their stimuli using a Pixel Mode digital trigger as a reference point.
An overview of video signal transmission
There are a lot of steps between when your experiment software “starts” displaying content and when your display physically emits light. Very simply:
-
The user executes commands related to visual stimulus generation/manipulation
-
Image data is rendered by your graphics card and transmitted to your display
-
The display must interpret this data
-
The physical illumination of the display takes place
The timing properties of each step can vary depending on various factors, including your experiment loop and rendering complexity, your PC’s processing power, the type of buffering technology employed by the GPU and display, the type of display, and the display’s refresh rate.
Many researchers rely on a ‘flip’ timestamp reported by experiment software as an estimate of stimulus timing. This estimate typically does not consider steps #2-4 above and may be imprecise in its estimate of step #1, particularly if your display is dropping frames.
VPixx displays have a special feature that detects video frame onset as the signal reaches the display hardware and sends a digital pulse to indicate this moment. Combined with an understanding of our display technology, we can thus characterize display illumination behaviour with an extremely high degree of precision, and demonstrate the deterministic timing of our displays.
Measuring pixel illumination on the VIEWPixx
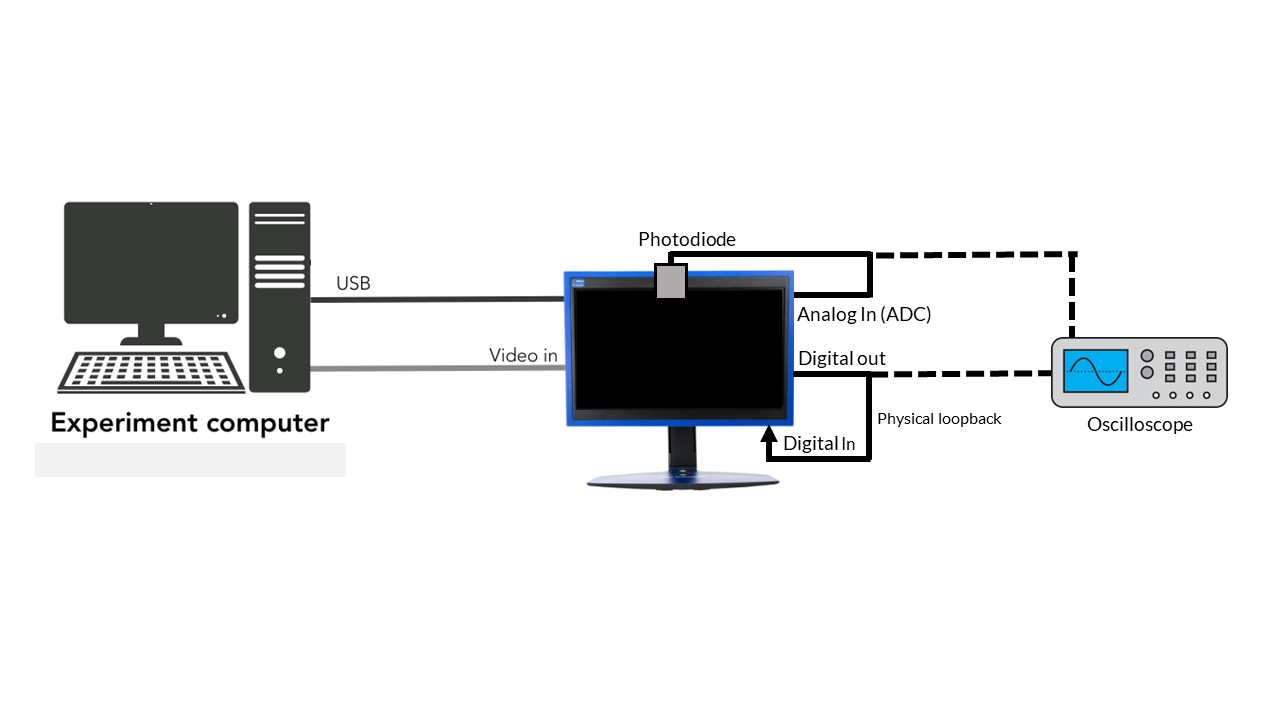
To measure changes in luminance on a display, we use a photodiode, a sensor that converts photons of light into electrical current. In a photodiode, changes in luminance result in changes to an output current, and this relationship is highly linear (within the standard operating range of display luminance). When the photodiode is coupled with a trans-impedance amplifier, the change in current is converted to a change in voltage, which is measured on an oscilloscope or an analog data acquisition system (e.g. the analog to digital converters on a DATAPixx3 or the VIEWPixx/3D).
To measure luminance changes from a monitor, the photodiode must be placed right up against the screen, and ambient lighting in the room should be kept to a minimum. Here, we will demonstrate how to record the photodiode output using an analog schedule.
The video frame-locked triggers, signalling the start of a video frame, are sent using our Pixel Mode feature. The digital output is read back onto the digital input port of the data acquisition system using a straight cable (a “physical loopback”). We monitor the digital input using a digital input log. Since both analog schedules and digital input logs use the same hardware clock, it is simple to relate the two events with microsecond-precise timing.
The stimuli we display for our photodiode measurements is a simple alternation between white and black frames at 120 Hz. Below is MATLAB/PsychToolBox code for displaying alternating white and black frames while sending Pixel Mode triggers at the start of each frame. The code also shows how to configure and record Pixel Mode triggers and photodiode output. Feel free to copy and modify this code to reflect your own visual stimulus properties.
The code above saves recorded photodiode data in the array adcData and the timestamps of these samples in the adc_time array. The digital input log with our Pixel Modes triggers is stored in the din_data array, and their timestamps are in the d_time array.
In the next section, we will analyze sample recorded data for measurements on our VIEWPixx/3D display to demonstrate how the scanning backlight and the on-screen location of the measurements affect the time course of luminance changes.
Pixel illumination behaviour of the VIEWPixx/3D with a constant backlight
First, we will look at the photodiode measurements made on the VIEWPixx/3D while the scanning backlight feature is disabled; that is, the scanning backlight will remain constant, mimicking the behaviour of a commercial LCD panel.
The figure below shows the measured temporal profile of the change in luminance at the top of the screen while the display alternates between white and black frames. Notice the consistency/regularity in the response from frame to frame.

As the figure shows, as soon as a video frame reaches the display, the pixels at the top begin to change. The luminance ramp, however, is quite gradual and doesn’t peak until about 6 ms after the onset of the white frame (solid vertical line). At the onset of the black frame (dotted vertical lines), the luminance drops rapidly.
If the photodiode is placed at the center or bottom of the screen instead, the overall profile of the pixel behaviour is the same, but the luminance ramp onset is later (~4 ms mid-screen, ~8 ms bottom of screen). This is due to the LCD's row-by-row updating, as discussed in the introduction.
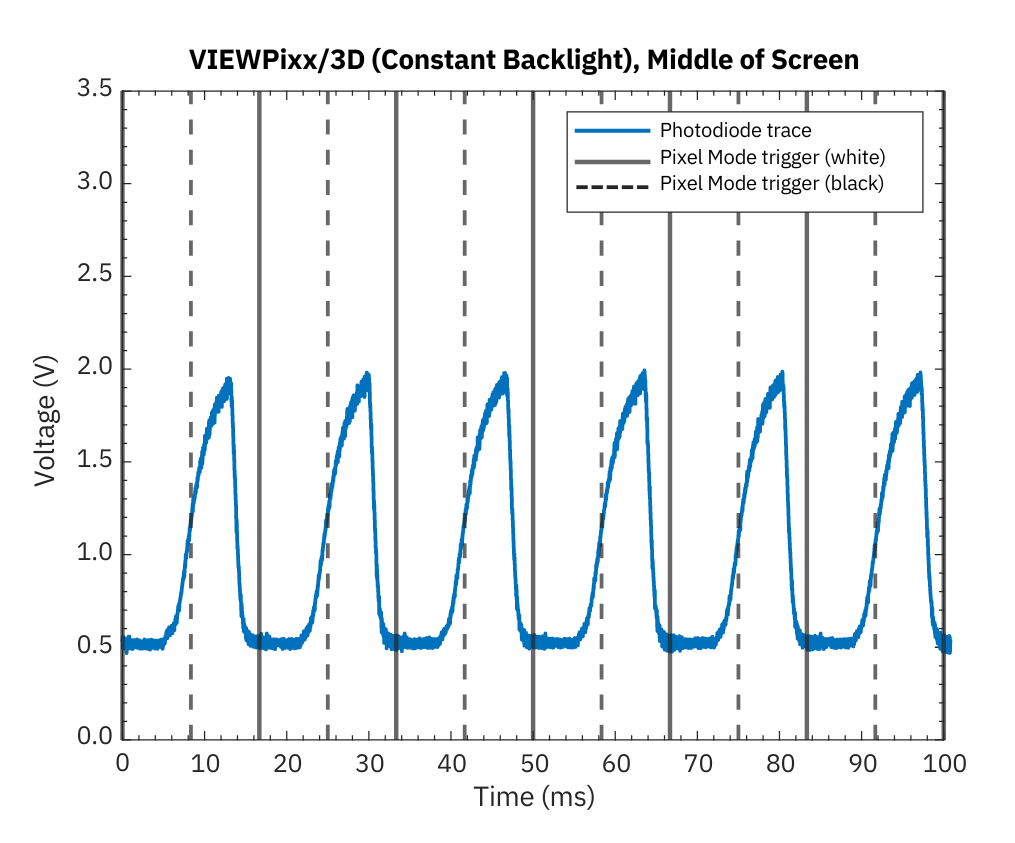

The VIEWPixx /EEG does not support disabling the scanning backlight; however, if the backlight feature on the /EEG were disabled, it would have a temporal profile similar to the pattern shown above.
Pixel illumination behaviour of the VIEWPixx/3D with a scanning backlight
Above, we showed the time course of luminance changes for alternating white and black frames on the VIEWPixx/3D with a constant backlight. This demonstrates ‘typical’ behaviour for a modern LCD panel. Here, we repeat our stimulus presentation and photodiode measurements with the scanning backlight enabled.
The temporal profile of the change in luminance at the top, middle and bottom of the display are shown below:
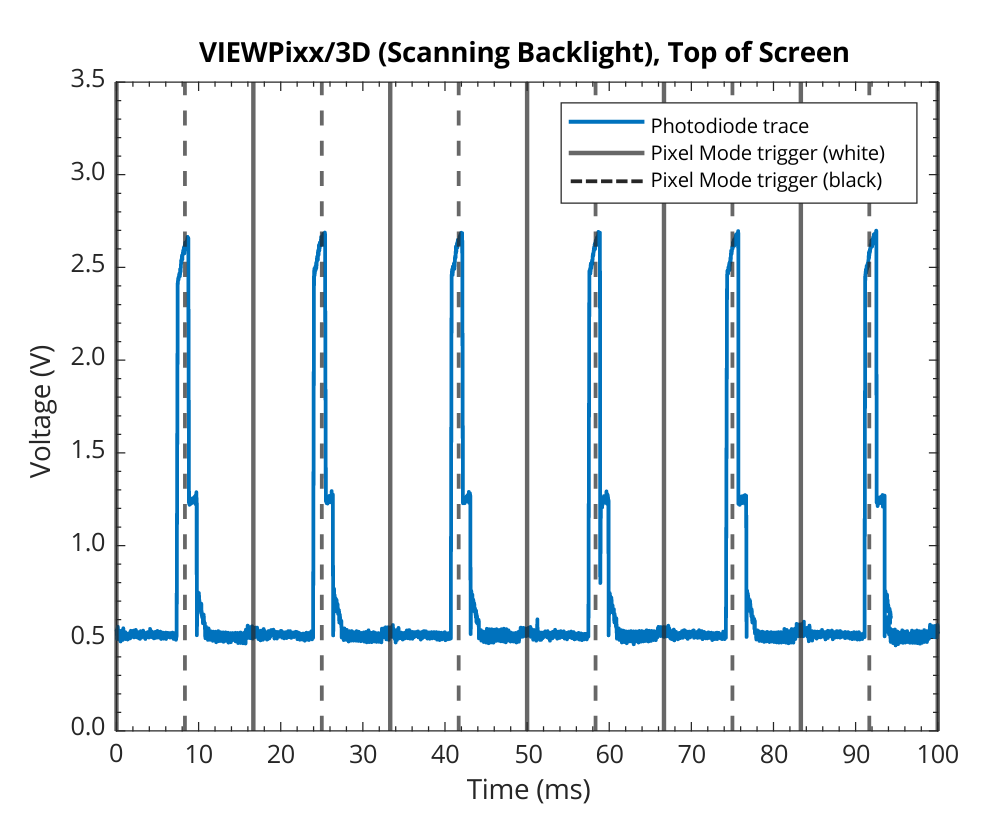
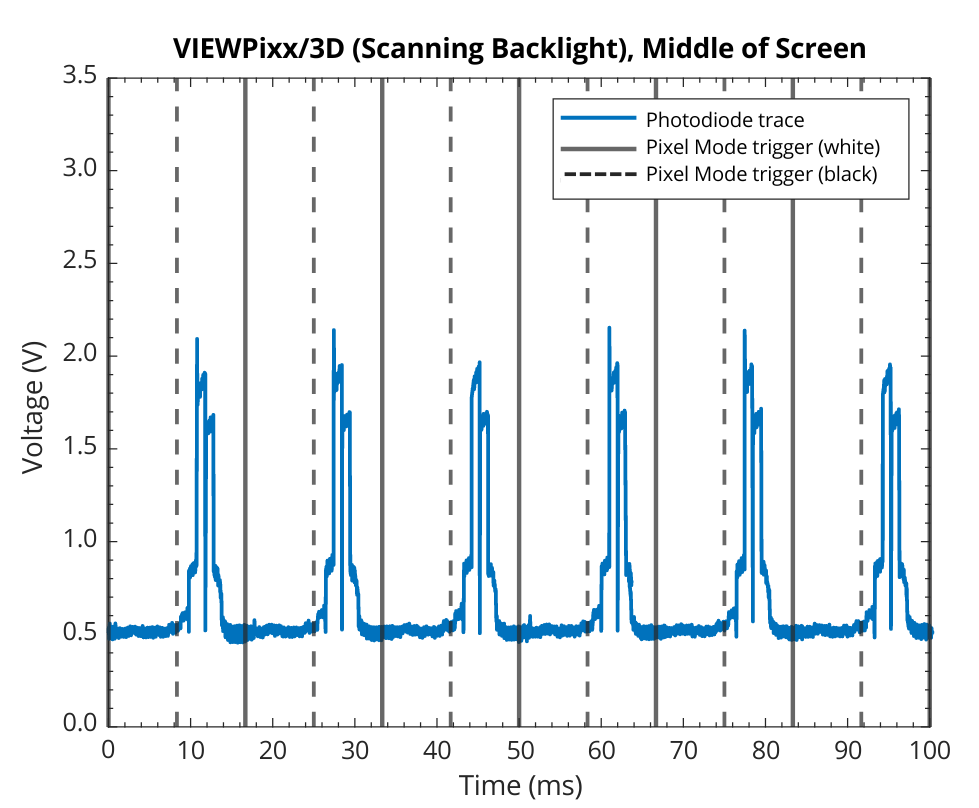
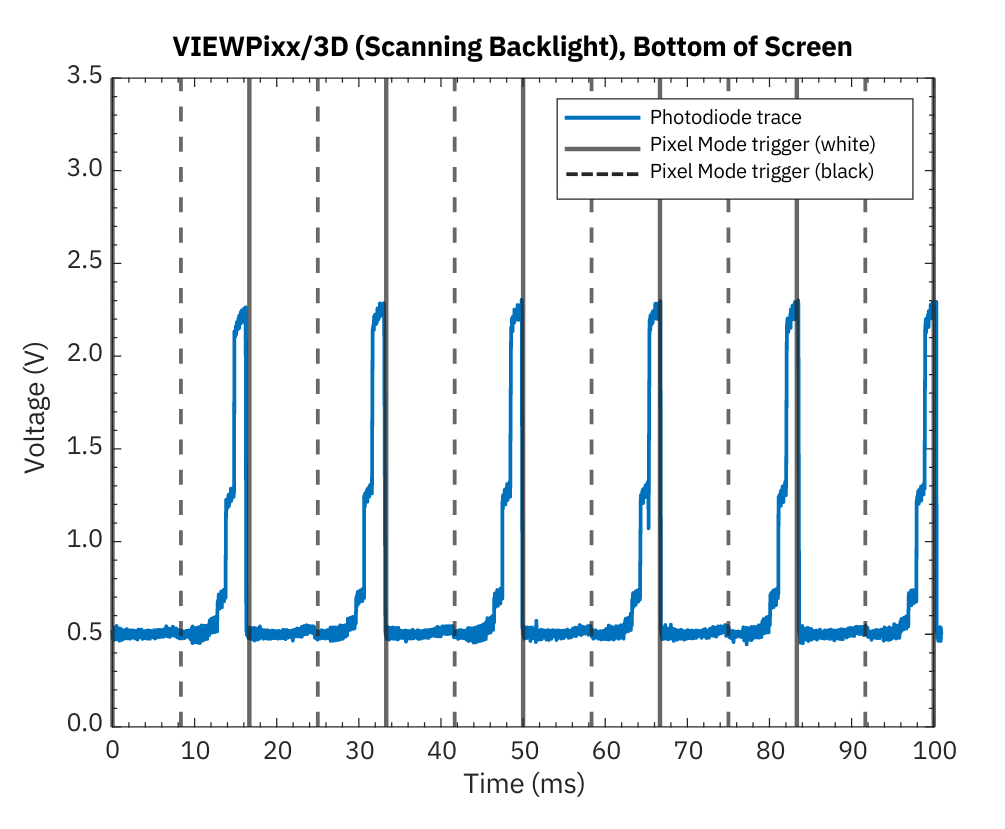
The scanning backlight substantially alters the luminance profile of pixels on the display. At the top of the display, the luminance ramp recorded with a constant backlight is replaced by a sharp rise in luminance exactly 6 ms after a new frame begins. Thus, the scanning backlight only starts when the pixels at the top of the display have fully stabilized. Shortly afterwards, the backlight shuts off, causing a rapid fall in luminance. The full pixel illumination phase only lasts 1 ms. The scanning backlight thus mimics the rapid pixel illumination/extinction of a CRT, which is crucial for eliminating ghosting and motion blur artifacts.
There are several other features to notice in these results:
-
The scanning backlight is a travelling strobe that sweeps down the display in parallel with pixel stabilization. Thus, it supports the row-wise updating of the LCD panel while ensuring that only fully stabilized pixels are illuminated.
-
A luminance half-step lasting ~1 ms is visible trailing the top row, leading the bottom row, and on either side of the middle row traces. This half-step is the photodiode capturing luminance changes in subsequent/preceding rows respectively. Since there are no preceding rows on the top of the display, there is no leading half-step; at the bottom, there are no subsequent rows, so there is no trailing step.
-
Photodiode placement matters. The “middle” photodiode placement has a double step, suggesting it straddles two rows of the scanning backlight and captures illumination from both
Visualizing the scanning backlight behaviour across the display
Below is an interactive visualization of the pixel stabilization ramp and the illumination profile of pixels in scanning backlight mode, changing from black to white on a single frame.
The Pixel Mode trigger is shown in the first trace and is locked to the frame transmission start. The frame transmission start and end are indicated with red lines. Click on different display rows to see the temporal offset between frame transmission time, pixel behaviour and peak pixel illumination.
Summary
The VIEWPixx /3D automated triggering and analog/digital acquisition system facilitates measuring the display’s subframe illumination properties. We can easily compare the row-wise pixel illumination profile in constant backlight mode, which shows typical LCD panel behaviour, compared to scanning backlight mode. The scanning backlight on the VIEWPixx /3D and /EEG imitates the rapid row-wise illumination and extinction of CRT monitors on a modern LCD. It has several characteristic features ideal for precision research equipment:
-
Integrated with modern LCD technology to follow the row-wise updating of the display and only illuminate pixels that have stabilized
-
Symmetrical rise/fall times ensuring minimal motion blur and a clearly defined pixel onset/offset
-
Value- and frame-independent illumination to minimize ghosting/crosstalk and ensure consistent display timing across all stimuli
-
Fully deterministic timing with respect to the frame transmission start, which is precisely reported by Pixel Mode triggers
One downside of the scanning backlight is that eliminating the 'display and hold' approach of a constant LCD backlight reduces the overall luminance of the display (eg., 250 cd/m2 in constant backlight mode vs. 100 cd/m2). VIEWPixx /3D users who wish to present static, bright stimuli may thus want to disable the scanning backlight using LabMaestro or our API commands and use the constant backlight for their specific application. The scanning backlight on the VIEWPixx /EEG cannot be disabled.
It is important to note that Pixel Mode triggers (or customizable Pixel Sync triggers) ensure digital trigger output is locked to frame data transmission start with microsecond precision. On a VIEWPixx series monitor, image presentation begins immediately upon receipt of frame data. There is no pre-processing or buffering, which means that the reception of a video frame, combined with an understanding of scanning backlight timing, is enough to characterize visual stimulus properties with millisecond precision or better. This directly translates to more precise behavioural and neurophysiological data segmentation, enhanced reliability, and better analytical power in your research.
In the next installment of this VOCAL series, we will use the same methodology presented above to measure the temporal profile of luminance changes on our PROPixx DLP projector while presenting alternating white and black frames at each of its supported refresh rates from 120 Hz to 1440 Hz.