Overview
This page provides an overview of the features available in the LabMaestro Experiment Builder. From this, we show the steps necessary to build a quick template experiment that displays a moving dot that changes colour across trials.
Building Your First LabMaestro Experiment
For this experiment, let’s say we want a dot to move across three different horizontal positions, as well as change colour between red, blue and green. The circle is visible for up to 5 seconds, or until the participant provides keyboard input.
If you simply want to follow along without manually entering the information or want to refer to the template, please download the following LabMaestro project: testTrials.lm
Adding a Display
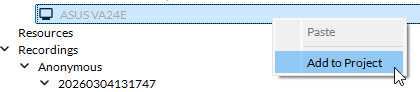
As a first step, you should always add a Display to your experiment to ensure your video feed is sent to the proper monitor. To do this, simply look at the Project panel, to your left, and under Environment. By default, you should see a list of all monitors and VPixx hardware connected to your computers. Right-click on your desired display and select Add to Project to make it your main display.
Defining Variables
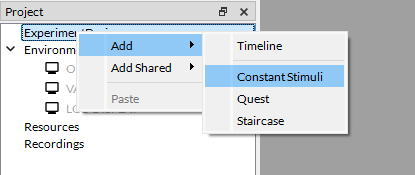
As a second step, we should define our variables using a Method component. Methods allow the software to handle variables related to your experiment design. For this project, we will use the ConstantStimuli Method. You can create a new method of this type by right clicking the ExperimentDesign → Add → ConstantStimuli:
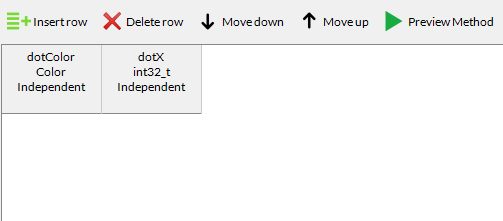
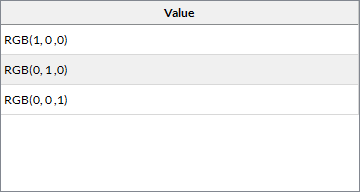
This will open a window showing the editable Method properties; for now, let us leave everything as the default. We need to define two variables using the Define a New Variable prompt on the right. These variables are:
-
dotX: The circle X coordinate (integer type)
-
dotColor: The circle colour (color type)
Once done, your variables will appear in the condition list viewer, as shown below.
Populating Variable Values
Now that our variables are defined, we can press Generate Crossed Design on the right to define the possible colours and circle position across trials.
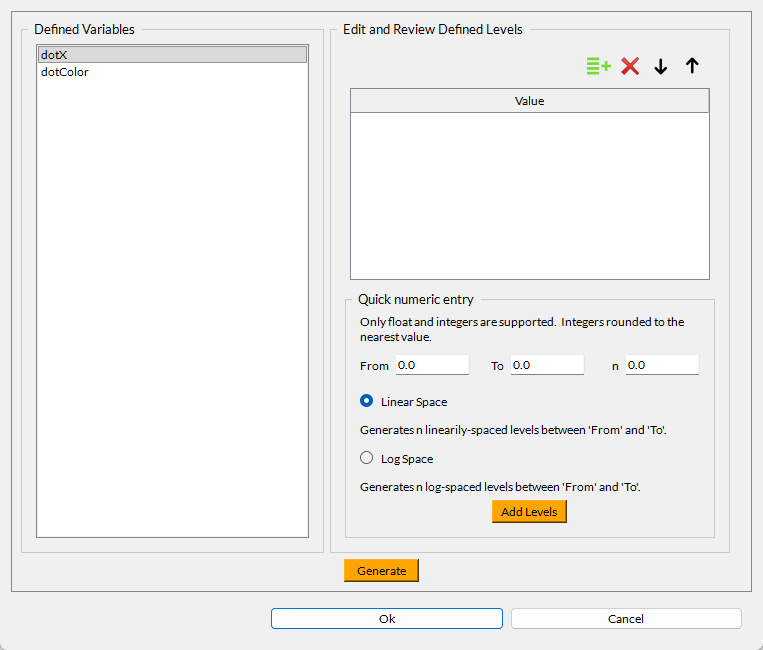
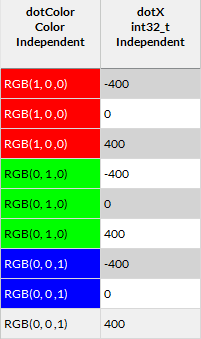
Let’s say, for our experiment, we want to define three colours (Red, Green, Blue) and three positions (-400, 0, 400, in pixels). We can add each value to each variable by clicking the green button to add a row and entering the values.
Once this is done, press Generate at the bottom of the window to automatically populate your condition list with a crossed design of all possible combinations of variable levels. For our experiment, our condition list now looks like this:
If you prefer, you can also manually populate the condition list using the Insert Row button. Support for directly importing a condition list from a *.csv file wll be available in a future release.
Building the Timeline
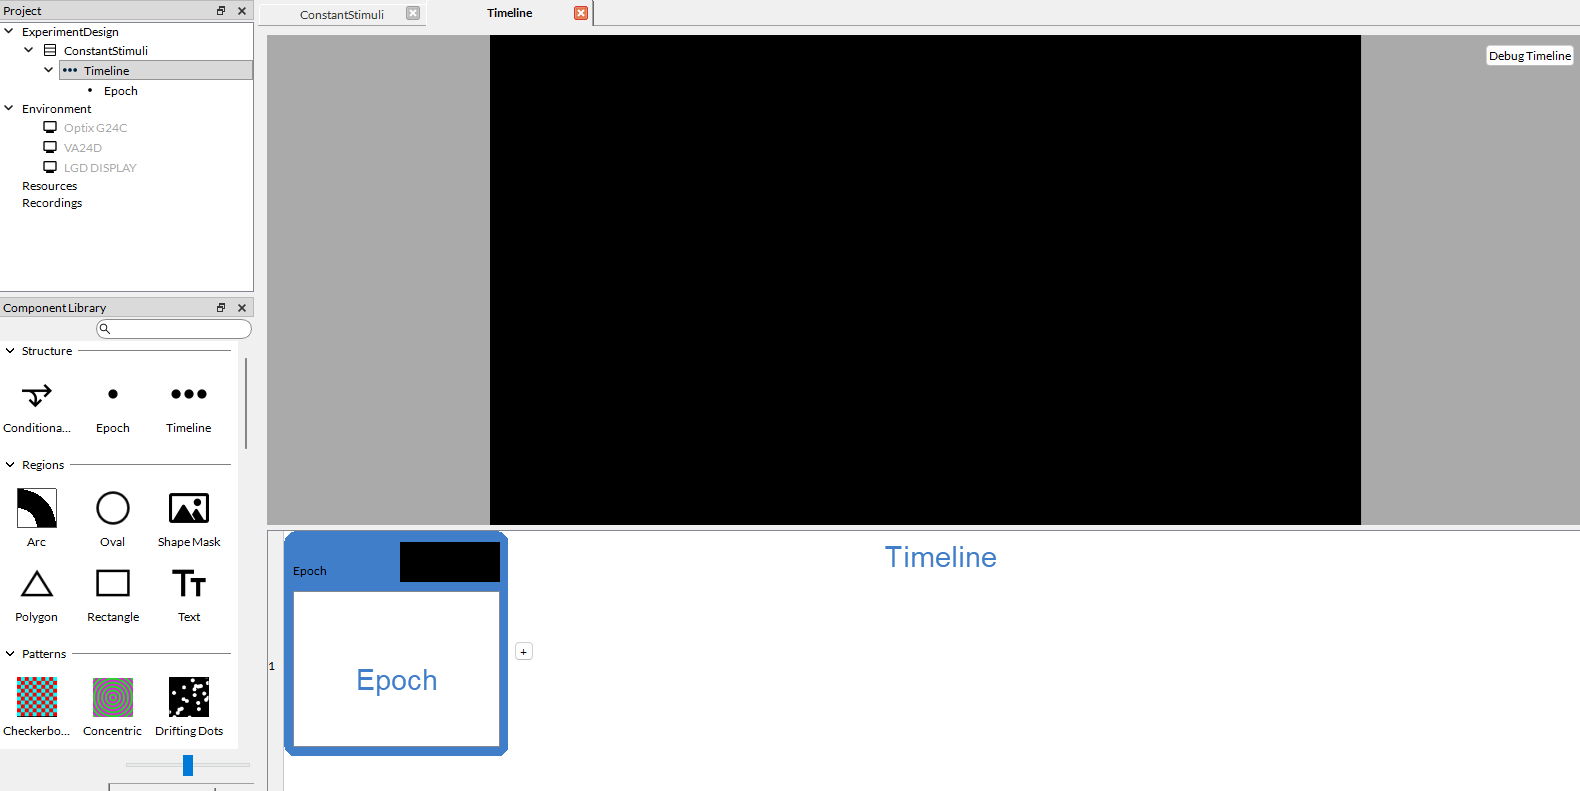
Now, we want to build the actual experiment. When we added the ConstantStimuli Method to our experiment, LabMaestro also automatically created a Timeline and an Epoch. The Timeline represents the global flow of our experiment, and each Epoch is a subset of steps.
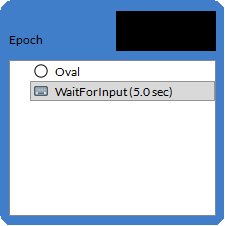
In this case, we will populate our Epoch with two Components:
-
A Command, in this case WaitForInput, to record participant inputs
From the Timeline View (accessed by clicking on Timeline in the Project panel), we can drag and drop these two components into our Epoch.
Then, we can customize our Component properties to fit our desired flow:
-
For the Oval Region:
-
We change the Center.X property value to =dotX, which represents the positions we defined in our Method.
-
We change the Color type to Solid, and define the value as =dotColor, which represents the possible colours we defined in our Method.
-
-
For the WaitForInput Command:
-
We change the Inputs property to accept inputs from the R, G and B keys.
-
Running the Experiment
Our experiment is now ready to be run! Press the Launch Experiment button to try it out.
Viewing Data
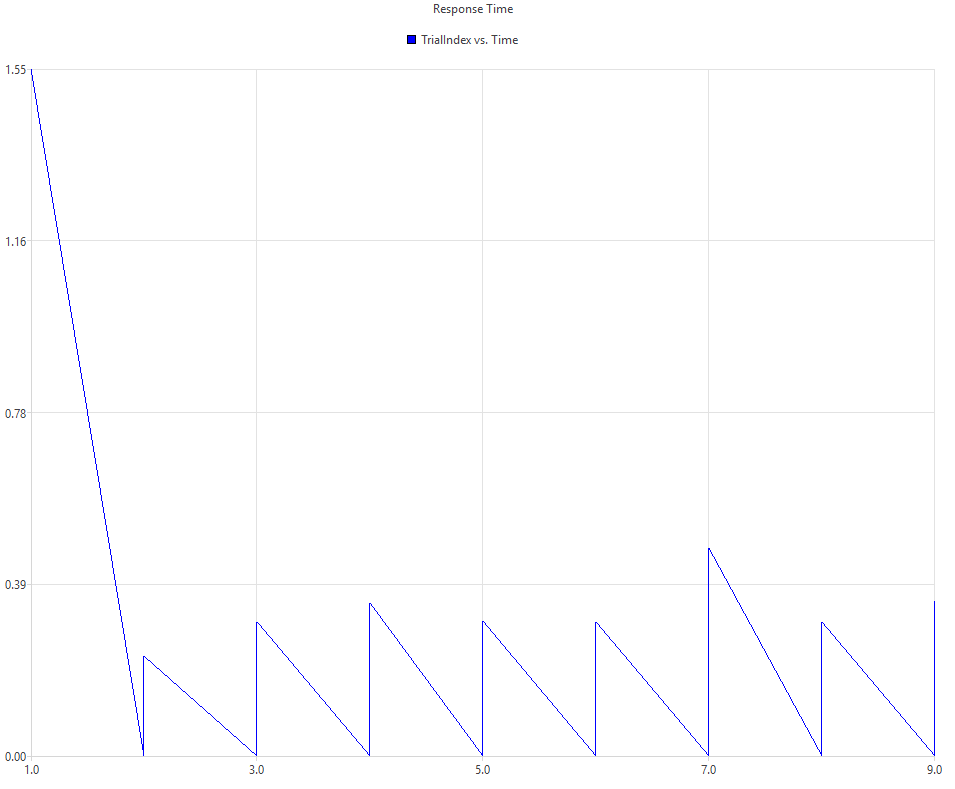
Once you have run your experiment, you can also view your Recordings directly in LabMaestro. In the Project Panel on the left, under Recordings, you can find the experiment sessions and data files. A file named MovingDot.mtd (or ConstantStimuli.mtd if you did not rename your method) will be available. This will open the built-in data visualization tools. You can edit the Series property to select the variables you wish to visualize. Here, we select TrialIndex and TrialRelativeTimestamp.
Exporting Data
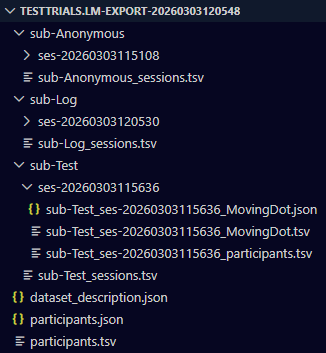
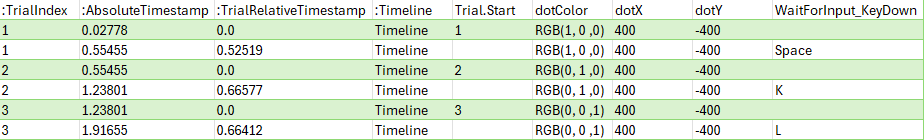
You can also Export your Data to visualize it in another software. To do so, right-click on Recordings and select Export. This will create a folder structure following the BIDS format. You can export your data files either to *.csv or *.tsv format, which are compatible with most statistical and programming software.
Next Steps
If you want to get started using LabMaestro for your experiments, please see the following pages: