Introduction
This demo will show you how to record eye tracking data as your participant follows a moving target.
Prerequisites
-
LabMaestro is installed and activated
-
You have access to a VPixx eye tracking device (TRACKPixx3, TRACKPixx Mini)
Project Files
Step 1 - Add your TRACKPixx to the Project and Wake it
First, after opening LabMaestro, go to the Project tab, under Environment. Right-click on your TRACKPixx device to add it to your project. You can then use the Wake TRACKPixx command in the top menu bar to start your device.
Step 2 - Calibrate your TRACKPixx
By clicking Configure TRACKPixx in the top menu bar, you can set up your tracker as needed. We recommend using the Find Optimal Settings option to define search limits and the expected iris size quickly. You can then run a calibration to ensure your tracker is properly following eye position on your display.
For more information on TRACKPixx calibration with LabMaestro, please see this page.
Step 3 - Use Tracker Commands to Record Eye Positions
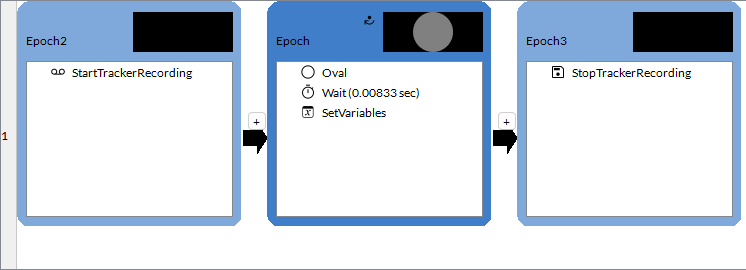
LabMaestro offers commands for the start and end of tracker recordings: Start Tracker Recording and Stop Tracker Recording, respectively. You can use the Start Tracker Recording command whenever you wish to start a recording. Use Stop Tracker Recording when your trial/task is over to generate a file containing recorded eye data.
In the accompanying demo, the recording schedule starts in a separate Epoch before the task. A moving circle is then displayed, rotating one degree per frame. The experiment lasts until the circle rotates 2700 degrees. The recording schedule then stops in a final Epoch.
Step 4 - Use LabMaestro Data Visualization Tools to Inspect Your Data
Once the experiment is complete, you can go to Project > Recordings to find your data file. Opening it will reveal an automatically generated fixation map. You can customize it and visualize different aspects of your data using the data visualization tools.
For more information on using the LabMaestro data visualization tools, please see this page.

Related Links
Calibration with the TRACKPixx3
TRACKPixx3 Hardware page