Introduction
The goal of this demo is to showcase LabMaestro's functions using a contrast-sensitivity measurement task. Contrast sensitivity is measured for 16 different spatial frequencies (1-16 cycles/degree). The idea is to use a staircase procedure to determine the detectability threshold for a grating stimulus. You can then use this to plot an estimate of the participant's contrast sensitivity function.
Prerequisites
-
LabMaestro is installed and activated.
Project Files
Experiment Timeline
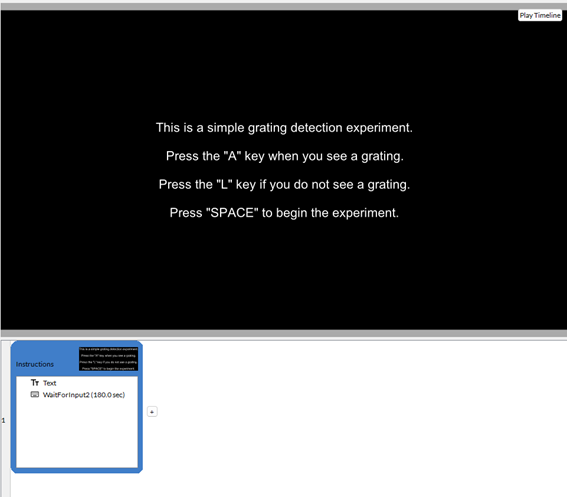
The demo experiment begins with a simple Timeline to explain instructions to the participant. Once the participant presses the SPACE key, the experiment begins in earnest.
The second and third timelines now handle the actual experimental trials using a Staircase procedure. The goal here is to detect two reversals. In the Descending timeline, a visible Grating (.1 contrast) will appear, and the participant will press the A key until the grating becomes invisible, causing the first reversal. Then, the participant will press the L key until the grating becomes visible, leading to the second reversal. The contrast between the grating stimulus and the background is varied in increments of 1% (.01 contrast units). Participants will replicate this procedure for each of the 16 measured spatial frequencies. The Ascending timeline proceeds in the same way; however, the grating starts invisible (0 contrast). As such, reversals are measured in the opposing order.

In healthy controls, the target detectability threshold is as low as 1% for a variety of targets and conditions (Fechner, 1860; Masson, 1845). However, contrast sensitivity could be affected by a variety of factors such as aging or visual conditions.
Data Visualization
Once the experiment is complete, you can use LabMaestro visualization tools to plot the results and observe the detection threshold for all conditions. As an example, you can load the Descending.mtd file, under the Recordings tab of the Project window (included in the subject Sample_Data).
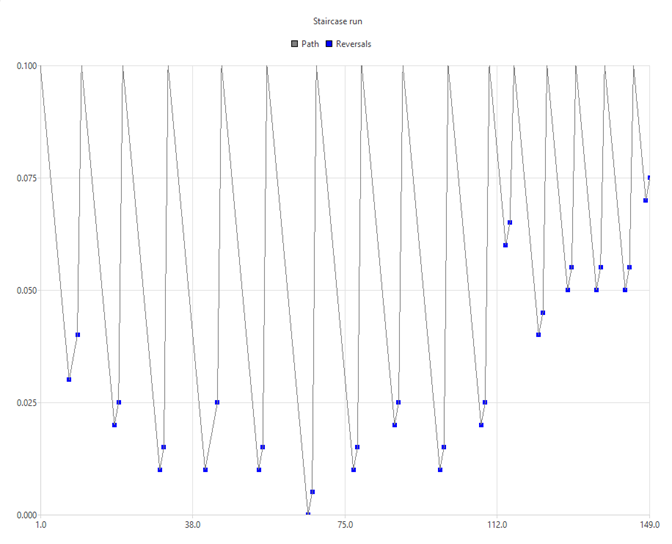
By default, LabMaestro opens a graph that plots total time spent since the beginning of the experiment for each trial. To get a better visualization, you may open the Staircase run preset from the preset property in the graph Properties window. showing you a graph including all key presses and reversals.
Since we are mostly interested in reversals, we can remove superfluous information using the series property in the Properties window. Press the red X while selecting the Ups and Downs series. Doing this will leave only reversals and the path across trials visible on the graph. Looking through the sample data, we see that sensitivity decreases in higher spatial frequencies, as expected. The data can also be exported outside LabMaestro for more detailed analyses in your preferred software by right-clicking Recordings in the project window and selecting Export.