Introduction
This project template demonstrates how to utilize the TRACKPixx3 eye tracker to replicate Yarbus's (1967) findings, which showed that viewing patterns change in response to task demands.
In this demo, we present a painting three times and collect 8 seconds of free viewing per presentation. Before each viewing, a different question is asked relative to the painting. After collecting gaze data, we can visualize fixations overlaid over the visual stimulus for initial inspection.
Prerequisites
-
LabMaestro is installed and activated.
-
An eye-tracking device (e.g., TRACKPixx3) is connected to your computer via an I/O hub (e.g., DATAPixx3).
Project Files
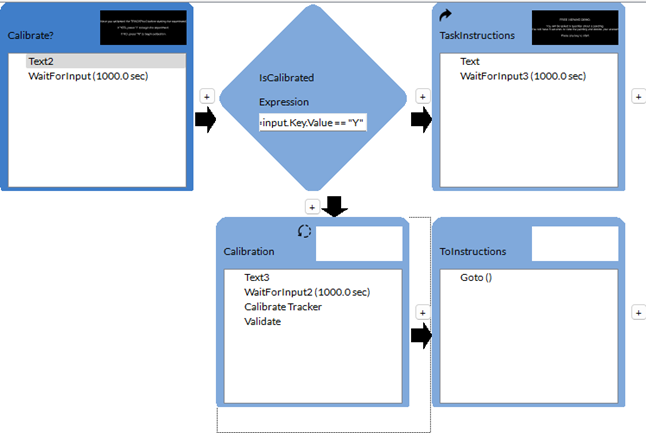
Step 1 - Tracker Calibration & Instructions
An optional calibration step is included in the template experiment. If you have not previously calibrated the tracker, you can initiate a Calibration routine by pressing the N key. This routine loops until the average offset measured during validation is lower than the acceptable offset defined in the Validate Tracker component (named Validate). If the tracker is already calibrated, press Y to view instructions and begin the experiment.
Step 2 - Data Collection
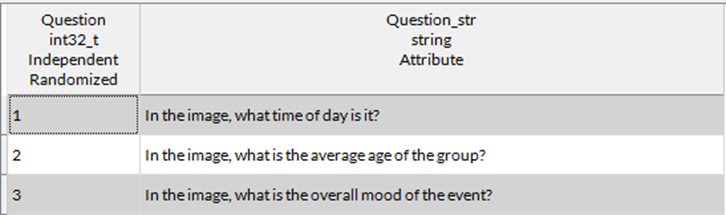
Once the calibration step is complete, we use a Constant Stimuli method to show three trials with different tasks. Participants will examine the Luncheon of the Boating Party painting by Auguste Renoir and complete three tasks presented in random order. The questions asked are:
-
In the image, what time of day is it?
-
In the image, what is the average age of the group?
-
In the image, what is the overall mood of the event?
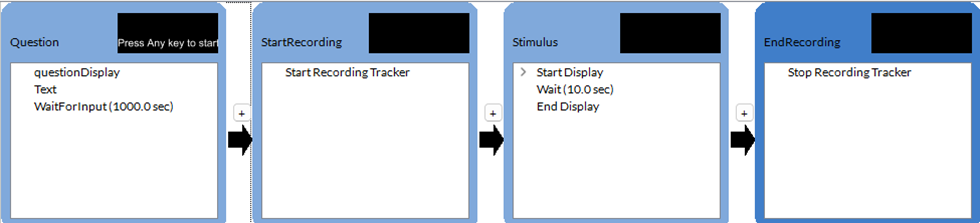
This is implemented in the timeline below, which loops for each trial. Looping is automatically performed to cover all the conditions defined in the Method component. A separate fixation data file is saved for each trial. The file is named after the Subject ID and trial number.
Step 3 - Data Visualization
We have included sample data in this demo to highlight data visualization using LabMaestro. It can be viewed by clicking Recordings, Sample Data, and selecting the session 202410291457. Three .trk files are available for each question. For example, here is the content of sampleData_1.trk file (In the image, what time of day is it?). Feel free to examine fixation data for the other trials as well.
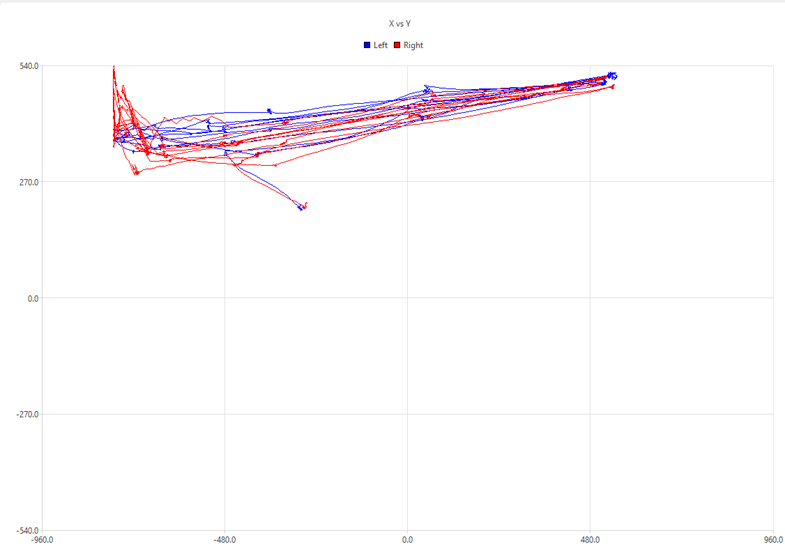
By default, the data visualization window plots fixations relative to screen coordinates (with point [0, 0] at the center of the screen).
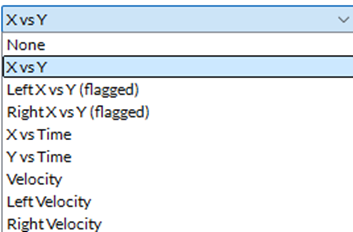
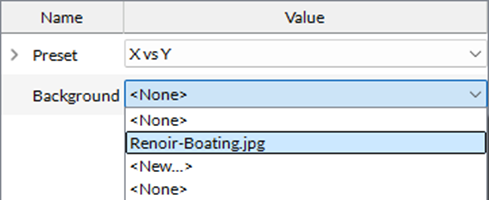
For this demo, we can use the default X vs Y plot. To better understand this data, we can add the visual stimulus to the background of the visualization window. As the stimulus fills the full screen, select the stimulus (Renoir-Boating.jpg) in the Background property.
For this demo, we can use the default X vs Y plot. To better understand this data, we can add the visual stimulus to the background of the visualization window. As the stimulus fills the full screen, select the stimulus (Renoir-Boating.jpg) in the Background property.
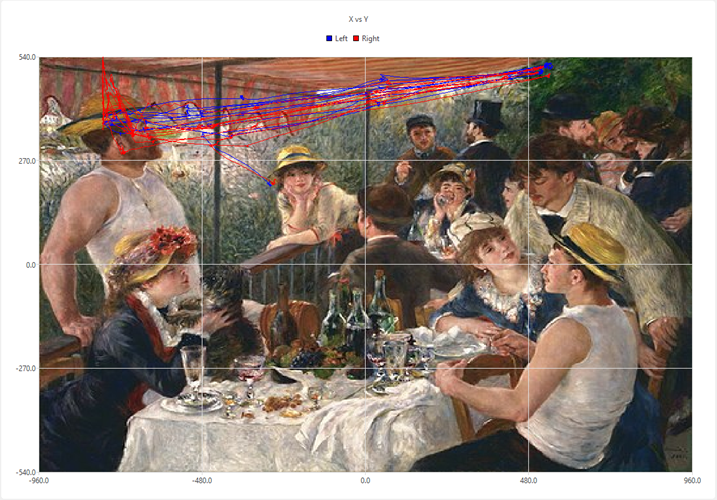
This will change the data plot to look like the figure below, making it much easier to interpret the data:
If you wish to export data to run more in-depth analyses using your preferred programming language, right-click Recordings in the Project tab and select Export. You can export all recordings saved in your project to the BIDS format.
Related Links
TRACKPixx3 page